
SAP BW Reporting
In SAP BI, Business Explorer (BEx) is one of the key component that allows you to perform flexible reporting and analysis and provides different tools that can be used for strategic analysis and supporting the decision makers in taking decision for future strategy.
The most common tools included in BEx are −
- Query
- Reporting
- Analysis Functions
Following are the key components in a Business Explorer −
- BEx Query Designer
- BEx Web Application Designer
- BEx Broadcaster
- BEx Analyzer
In SAP BI, Reporting is a result of query with Business Explorer.It is a formatted output of a query.
Business Explorer is used to serve all reporting need on SAP BI Info provider.
Query:
This is a combination of Projections, Selections, Agrregations. Query is used on specific Infocubes,DSO, Info objects(Data targets), Multi providers, Infosets, Remote info cubes.
Note: One query can provide information for one Info provider.But one Info provider can have N number of Quries.
n 1
In Bex, Query provides definition of data to be retrevied which is closely intergated with MS Excel.
Business Explorer(BEx):
1. It is a reporting tool on SAP BI.
2.It provides query and Report generation.
3.It is a environment to design,create report and analyze information.
Architecture of a Bex :
There are four components in the architecture of BEx.
1. BEx Query Designer
2. BEx Web Application Designer
3.BEx Broadcaster
4. BEx Analyzer
1.BEx Query Designer:
The Query Designer is a desktop application for creating queries, and plays an important role in the Business Explorer Suite. The queries created can be displayed as data providers for Web applications, reports, and workbooks and can be displayed ad hoc in the BEx Web Analyzer.
2.BEx Web Application Designer:
Web application design enables you to use generic OLAP navigation for your BI data in Web applications and in business intelligence cockpits for both basic and very specific scenarios. It also enables you to create Web-based planning applications.
You can use the BEx Web Application Designer, which is the central desktop application for creating Web applications, to generate HTML pages that contain BI-specific content such as tables, charts, or maps. Web applications are based on Web templates that you create and edit in the Web Application Designer. You can save the Web templates and access them from the Web browser or the portal. Once they are executed on the Web, Web templates are referred to as Web applications.
3.BEx Broadcaster:
BEx Information Broadcasting allows you to make objects with Business Intelligence content available to a wide spectrum of users, according to your requirements.
Using the BEx Broadcaster, you can pre calculate Web templates, queries, query views, reports, and workbooks and publish them to the portal, distribute them by e-mail, or print them. In addition to the pre calculated documents that contain historical data, you can also generate online links to queries and Web applications.
The Business Explorer portal role illustrates the various options that are available when working with content from BI in the portal.
4.BEx Analyzer:
It is a front end tool to build queries and reports. It is based on MS Excel environment, where queries and analysis are define by selecting characteristics and key figures. This presentation on MS Excel allows user to take a view and manipulate it as a document.
How to launch a BEx Analyzer:
Click on START button
Programs
Business Explorer


BEx Analyzer Enter.

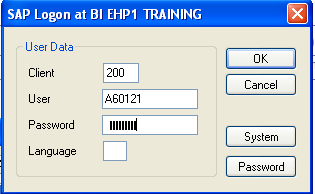
How to open a query designer:
Click on START Button
All Programs


Business Explorer

Query Designer Enter.


Enter the pass word and click on OK
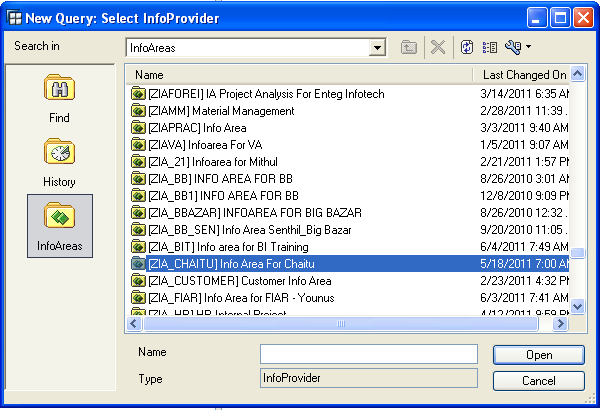
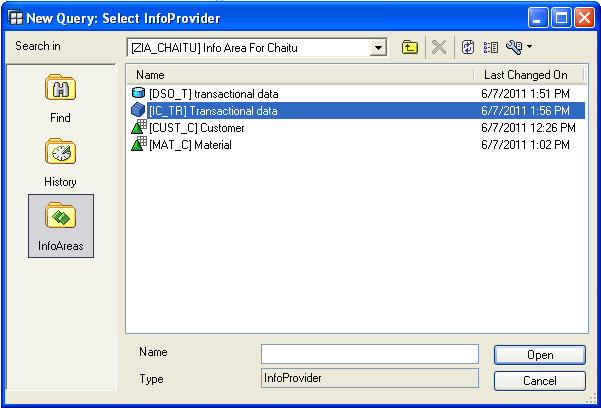
1.How to create a new query:
Click on create icon 
Inforea
Select your Info area

Select your cube and click on open.
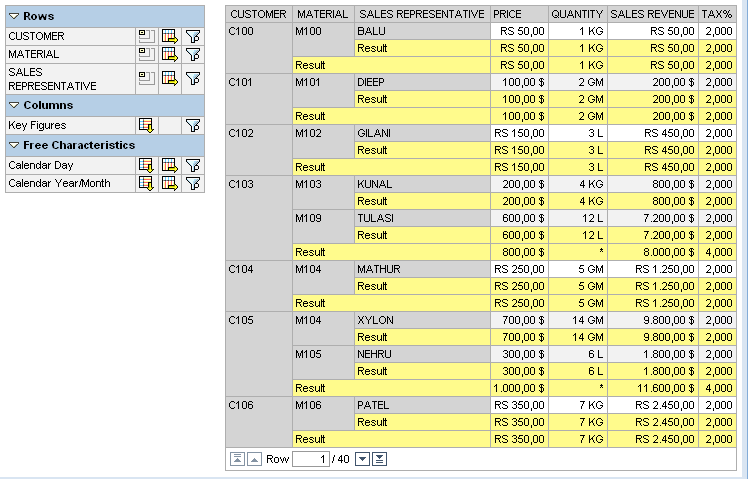
A query designer is divided in to 6 sub areas.
1. Dictonary panel or info provider panel.
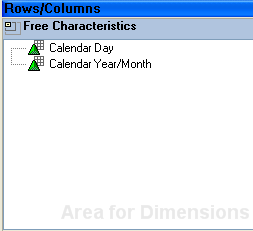
2. Free characteristics panel.
3.Row panel.
4.Column panel
5.preview panel
6.filter panel
Dictory panel
Or
Info provider panel
|
Filter panel
| |
Free characteristic panel
|
Column panel
| |
Row panel
|
Preview panel
| |
3.5 (Query designer)
1. Dictonary panel
All avaliable info objects in the info provider are available in this area.
All objects in the dictory panel are classified in to
1.Key figures
1.1 Calculated keyfigures.
1.2 Restricted key figures.
1.3 Basic key figures .
2.Characteristics
3.Structures.
2.Free characteristic panel:
Hide characteristic fields in the intial view of the query.Further we can drill down.
3. Column Panel:
You define the column of the report.(Ex: Keyfigures).
4.Row Panel:
You define the rows of the report(Ex: Characteristics)
5. Preview panel:
It gives the preview of the report.
6.Filter panel
The characteristic in the filter panel do not appear in the drill down.
Functions of a query designer:
- : Create a query
- : save as
- : check a query
- : Query properties
- : Filter
- : Rows and columns
- : Cell defination
- : Conditions
: where used list
Free characteristics:
Characteristics in free characteristic panel dont display intial view of the query result, but when we excute the query in the BEx analyzer we can integrate these characteristics in to the result area throught naviagation steps.
We can also use free characteristics for restricting with filters in the report.
Filters:
It is often necessary to restrict or filter to certain characteristic values in your report.
Filters can be defined two types:
1. Inclusion
2. Exculsion
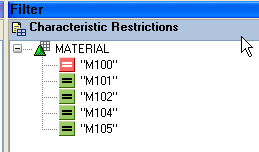
In this example,material M100 is restricted with exclusion and M101,M102,M104,M105 are restricted with inclusion.So, Report contains only M101,M102,M104,M105. And M100 doesnt show in report.
Calcuated key figure :
In a query designer, we can use basic key figures,calcuated key figures,restricted keyfigures to calculate a value during runtime.
1. Open a query designer.
2. Select key figures in Info provider panel.
Keyfigures
Right Click


New calculated Keyfigure Enter

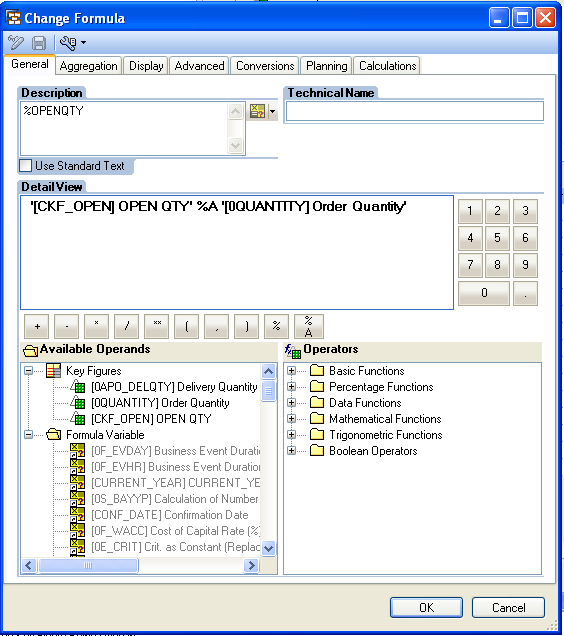
New formula:
New formula is local. It holds the same properties or functionalities of calculated key figure.And it is not a reuseable object.
Formula is specific to one query.unlike a calculated keyfigure is global and used across all the queries on the info provider.
Any changes to the calculated key figure will effect on the queries where these calculated keyfigure is used.
1. Select key figure structure in column panel
Key figure
Right Click

New Formula Enter.
Restricted keyfigure :
These are basic key figures of the info provider that are restricted by one or more characterstic values.
The key figure restricted can be a basic key figure, calculated key figure, restricted key figure.
Select key figure in Info provider panel
Key figure 
Right click

New resctricted key figures Enter.

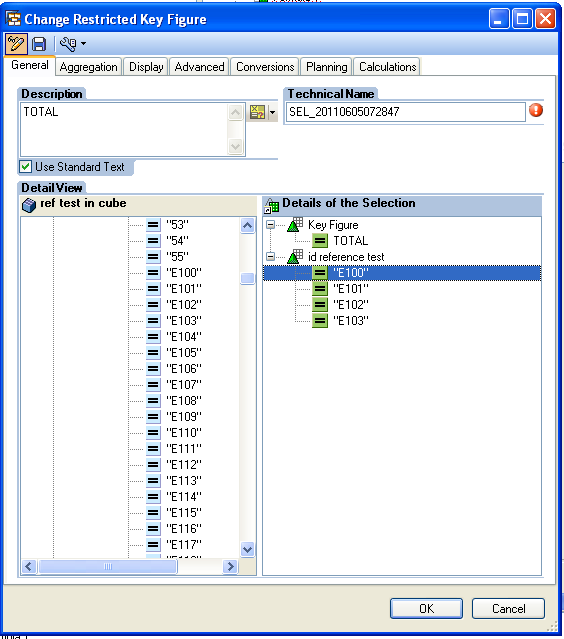
New Selection:
New selection holds the same properties and functionalites of restricted key figure
A new selection is local, specific to one query and it is not reusable object.
A restricted key figure is global and it is available across all the queries on that info provider. It is reusable object.
Any changes to the restricted key figure will effect on all queries where restricted key figures are used.
Select key figure structure
Right click

New Selection Enter.


Limitations and observation on query designer:
1. One characteristic can be used only onces in a query designer.
2.We can use same key figure at multiple times in the same query designer.
3.When ever we are using key figure in a query designer, a key figure structure is created by default.
4.The minimum number of structures for a query is 1(Key figure).
5.The maximum number of structures for a query is 2(Key figure and characteristic).
6.We can maintain some characteristics in rows and some in columns.
7.In case of key figure, we can maintain only in row or column.
Properties :
1.Properties of characteristic info objects:
In the characteristic property dialogue box:
We can change the description of the info object for these specific query.
Display as:
1.No display : wont show in report.
2.key & text : display as key and description.
3.text: displays only text.
4.key: display only key
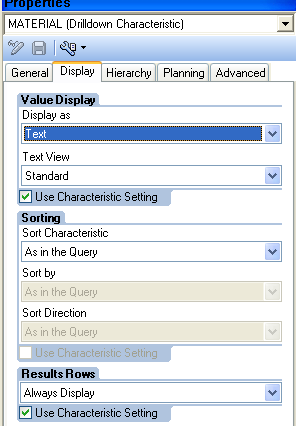
Sorting:
This is based on attributes of characteristics we can sort data in the query.
Result rows:
You can choose whether the results rows are Always Displayed, Always Suppressed, or Displayed If More than One Value. Display If More than One Value means that the results rows are displayed when there are at least two single values, and any results row that only aggregates one value is suppressed. In such cases, the value and the result are identical and the results row repeats the same value.
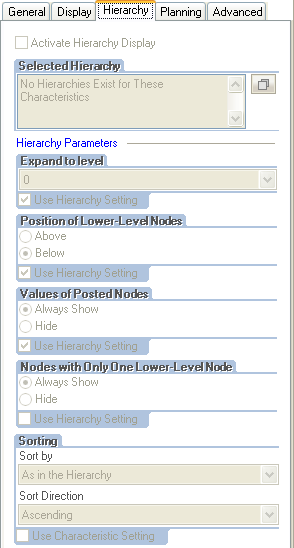
Hierarchy :
You can display the characteristic as a hierarchy. Choose to select a hierarchy (Selecting Hierarchies). The hierarchy is flagged automatically as an active display hierarchy. If you deselect the Activate Hierarchy Display checkbox, the characteristic is not displayed in the query as a hierarchy but as a basic list.
Tab Page: Planning
Planning on Hierarchy Nodes
Here, you can make settings for budgeting for input-ready queries in the context of BI Integrated Planning.
1. No Budgeting
2. Bottom-Up Budgeting (Roll Up Value)
3. Top-Down Budgeting (Posting to Higher-Level Nodes)
4. Top-Down Budgeting (Posting to Root Node)
Budgeting and the corresponding settings are not currently available. The selection options listed above are therefore visible, but not active.
Tab Page: Advanced
Access Type for Result Values
You can restrict the display of query result values:
1. Posted Values
When the query is executed, a row of data for the characteristic is only displayed if there are posted values for this characteristic.
You can use the Use Characteristic Setting indicator to specify that the default value is always used. The default value relates in this case to the Posted Values setting. You cannot specify the default value in Info Object maintenance.
This setting is only the default value if the characteristic is used in a reusable filter and a setting was made there.
2 . Characteristic Relationships
When the query is executed, a row of data is generated for the characteristic if you have modeled corresponding characteristic relationships in the planning modeler.
3. Master Data
When the query is executed, a row of data is always displayed for the characteristic. For the display, it is sufficient that values for this characteristic are maintained in the master data. The display does not depend on transaction data.
Filter Value Selection During Query Execution
You can specify how filter values are to be selected for query execution:
1. Only Posted Values for Navigation
The system displays posted values only.
2. Only Values in InfoProvider
The system displays only those values that are in the Info Provider.
3. Values in Master Data Table
The system displays all characteristic values from the master data, independently of transaction data.
4. Characteristic Relationships
The system uses the current restrictions from the filter of the query and only displays the characteristic values that are valid according to the characteristic relationships.
Use Characteristic Setting: If the default value is always to be used, set this indicator. You can specify the default value in InfoObject maintenance (transaction RSD1).
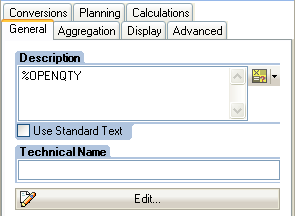
Properties of key figure info objects:
The key figure of a query produces some important functions
1.Description:
The function allow you to define query specific name for the key figure,.
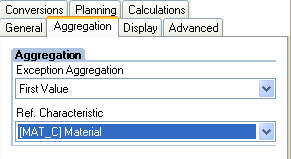
2.Aggregation:
This function is only available for formulas and calculated key figures.
Here, you can make settings for aggregation and calculation time (that is, for the detail level of the calculated key figure or formula). By default, the data is firstly aggregated to the display level; and then the formula is calculated (= standard aggregation). The exception aggregation setting allows the formula to be calculated before aggregation using a reference characteristic and then to be aggregated with the exception aggregation.
1. Use Standard Aggregation: You use this setting to specify that aggregation takes place before calculating the formula. You therefore do not use exception aggregation.
2.Total (SUM)
3.Maximum (MAX)
4. Minimum (MIN)
5. Exception If More Than One Record Occurs (NO1)
6.Exception If More Than One Value Occurs (NO2)
7. Exception If More Than One Value <> 0 Occurs (NOP)
8.Average of All Values (AVG)
9.Average of All Values < > 0 (AV0)
10.Average Weighted with Calendar Days (AV1)
11.Average Weighted with Working Days (AV2)
12.Count All Values (CNT)
13.Count All Values <> 0 (CN0)
14.First Value (FIR)
15.Last Value (LAS)
16.Standard Deviation (STD)
17.Variance (VAR)
18.No Aggregation Along the Hierarchy (NHA)
19.No Aggregation of Posted Nodes Along the Hierarchy (NGA)
If you use exception aggregation, you need to select a characteristic from the Reference Characteristic field.
The system will use this to calculate the formula before aggregation. In the Reference Characteristic field, you
can select from all characteristics in the InfoProvider
3.Display:
1.1 Always show:
1.2 Always hide:
1.3 Hide can be shown:
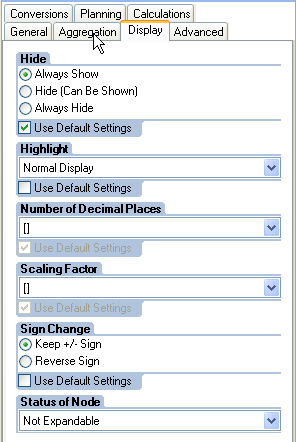
Highlight
You can choose whether you want to highlight the selection or formula. The type of highlighting depends on the style used in the BEx Analyzer or in the Web application.
Use Default Settings: You can specify that the default values are always to be used. In this case, the default value is the setting for the key figure used. If no key figure is found or if the key figure does not return this type of setting, Normal Display is used as the default value.
Number of Decimal Places
You can specify the number of decimal places. Numbers can have any number of decimal places from zero up to nine decimal places (0, 0.0, 0.00... to 0.000000000).
Use Default Settings: You can specify that the default values are always to be used. In this case, the default value is the setting from the key figure specified in InfoObject maintenance. If no key figure is found, the Query Designer cannot determine a default value. This is indicated by Standard Value Not Found.
Scaling Factor
You can specify a scaling factor between one and one billion. If you set 1000, for example, the value 3000 is displayed as 3 in the report.
Use Default Settings: You can specify that the default values are always to be used. In this case, the default value is the setting from the key figure specified in InfoObject maintenance. If no key figure is found, Query Designer cannot determine a default value. This is indicated by Standard Value Not Found
Tab Page: Advanced
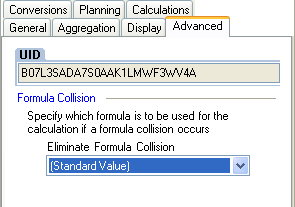
UID
In this field, the unique ID (UID) that is used for unique identification is displayed. This field is only used for information purposes. For example, you can use the UID in URLs of the Web API to address this element. However, we recommend that you use technical names, because UIDs can change when an object is deleted and then re-created.
Constant Selection
This function is only available for selections and restricted key figures.
You can select a selection as constant. This means that the selection cannot be changed by navigation or filtering at runtime and can therefore be used as a reference size.
Formula Collision
This function is only available for formulas and calculated key figures.
Whenever you define two structures that both contain formulas, it is unclear to the system how to calculate the formulas at the point where both formulas intersect
The following example illustrates the concept of formula collision:
Column 1
|
Column 2
|
Column 1 x Column 2
| |
Row 1
|
Value A
|
Value B
|
A x B
|
Row 2
|
Value C
|
Value D
|
C x D
|
Row 1 + Row 2
|
A + C
|
B + D
|
? Formula Collision?
|
In this example, there are two rows and two columns with simple values. The third row is a simple summation formula and the third column is a simple multiplication. In the cell in which the row and column formulas meet, it is not clear how the data is to be calculated.
If you calculate according to the column formula in this cell, the cell contains (A+C)x(B+D). If you calculate according to the row formula in this cell, the cell contains (AxB)+(CxD). The result achieved therefore depends on the type of calculation performed.
If a formula collision occurs, as described in the example above, you can specify which formula is to be used in the calculation. You can make the following settings in the Eliminate Formula Collision field:
Nothing defined
If you do not specify a value, the formula that was last specified and saved takes priority in a formula collision.
Use Result of This Formula
The result of this formula has priority in a collision.
Use Result of Competing Formula
The result of a competing formula has priority in a collision.
Collisions always occur when multiplication/division and addition/subtraction are mixed in competing formulas. If both formulas involve multiplication/division or addition/subtraction only, both calculation directions return the same result. Therefore, no settings are required for formula collision.
Currency Translation:
This function is only available for selections and restricted and calculated key figures.
You create translation types for currency translation under SAP Menu → Modeling → Object Maintenance → Currency Translation Types.
In Query Designer, you can set a target currency for a structural component.
Select a conversion type in the Conversion Type dropdown box. Depending on how the currency conversion type has been created, you have the following options:
Select the Target Currency When Converting
The target currency was not fixed in the conversion type, but can be determined during conversion. Select the required conversion type and enter the required currency in the Target Currency dropdown box. You can also select a currency from the dropdown box.
You can also choose the  icon to call the input help dialog box and select a variable target currency. By choosing the black arrow, you can navigate to the context menu and can then choose New Variable to create new variables or Change Variable… to change existing variables. Both options use the variable editor. When you execute the query, the variable screen appears. You can then choose the target currency.
Fixed Target Currency
The target currency was determined in the conversion type. Select the required conversion type with the fixed target currency. In the Target Currency dropdown box, the fixed target currency for this conversion type is displayed.
InfoObject Determines Target Currency
The target currency is specified in the conversion type so that it is determined from an InfoObject. Select the required conversion type with the target currency from the InfoObject. The text From InfoObject is displayed in the Target Currency field when you select this conversion type.
Target Currency from Variable.
In the conversion type, a variable was specified for 0CURRENCY. The text From Variable is displayed in the Target Currencyfield when you select this conversion type.
.
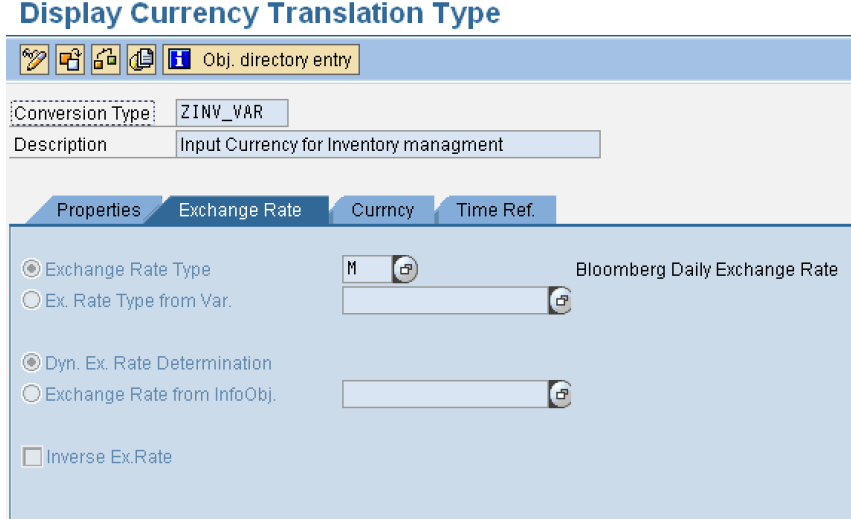
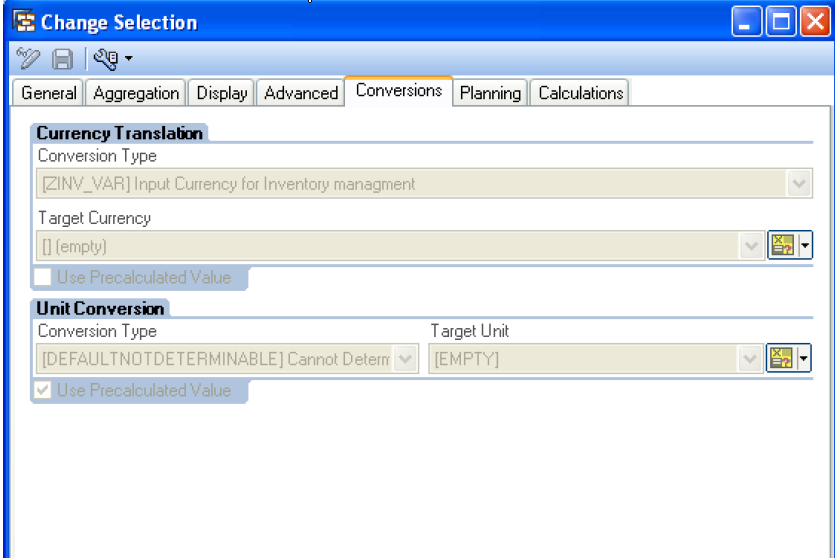
1. Go to the T code RSCUR and define the currency translation Type as ZINV_VAR and click the
create icon on the top
 |
2. On the exchange rate tab select the exchange rates (in this scenario I have selected exchange rate
type as M since exchange rates are updated in BI system on hourly basis)
3. In currency tab select the Target currency and the variable 0P_CURPR ( it is a variable to 0CURRENCY) since our aim is to get the currencies in Target currency by passing values to the variable.

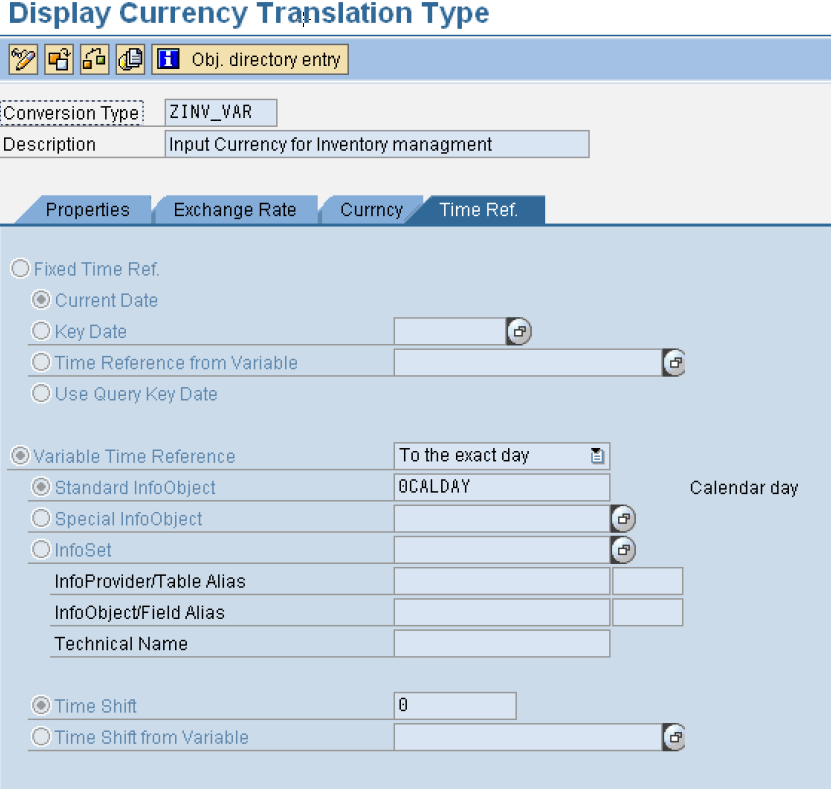
4. On the time reference tab select the time characteristics ( In this scenario 0calday has been used as Variable time reference since all the exchange rates for the time is stored in BI system, For example we need the data of last month particular day we should get the exchange rates of that particular day)
5. Log in into Bex and open the query
6. We want the Value of the stock and Price per unit in the Target currencies so value of the stock is obtained by calculating Stock on hand multiplied by price per unit so in this example calculated key figure has been taken
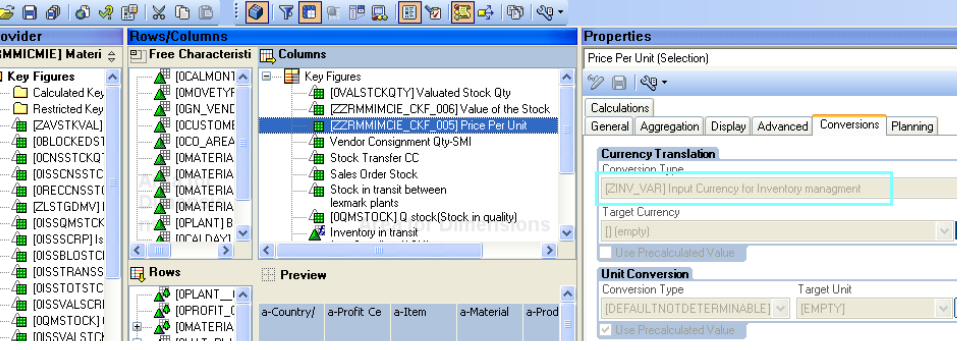
7. Currency type(ZINV_VAR) for the variable 0P_CURPR is selected from the tab conversions andFrom currency translation for the calculated key figure.
2.Calculation:
You use this function to recalculate results rows and single values that are displayed in the query, according to specific criteria.

1.calculated result as calculate single value as:
Last value normalized sub total.
First value normalize result(Include filter)
Maximum normalize overall result(Exclusive filter)
Minimum Ranked list
Average Max
Count Min
Count not equal too
Conditions:
By defining the condition you have the option by analyzing query result.By defining the condition you have the option the query result in more details.You can define multiple conditions for a query.
Click on condition icon 
And create new condition
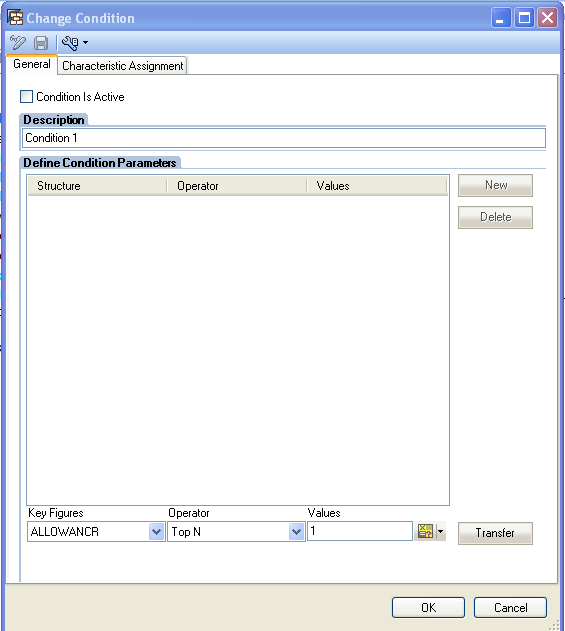
Click on new and select key figure “allowance“ and select operator “N“ and value 1. It shows top 1 customer.
Exceptions:
This Exception reporting enables you to select and highlighted or unusal deviation of key figure value in query,early reporting on such deviation will be the base for timely and effective reactions.
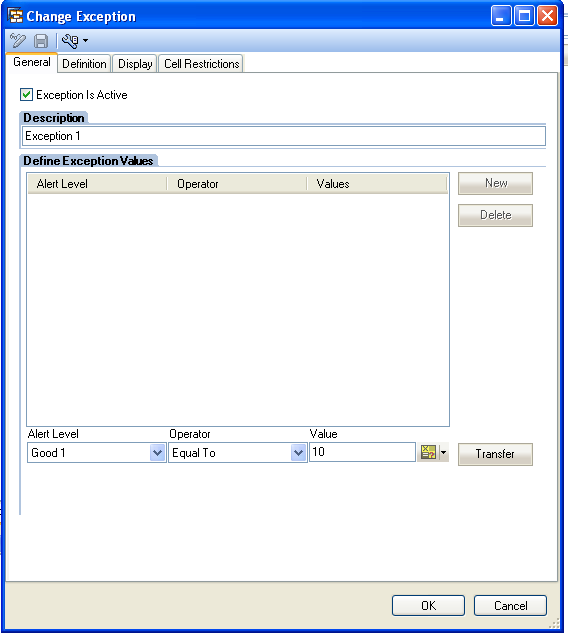
Select Exception icon  and create new exception
Click on New and enter above details and in definition tab select your key figure and click ok.
Query Jump Target or Report to Report Interface(RRI):
RRI will help us to jump from one query to another query.The reporting types are BW query,BW Web Application,Crystal Report,Infoset query,Transaction,ABAP report,Web Adress.
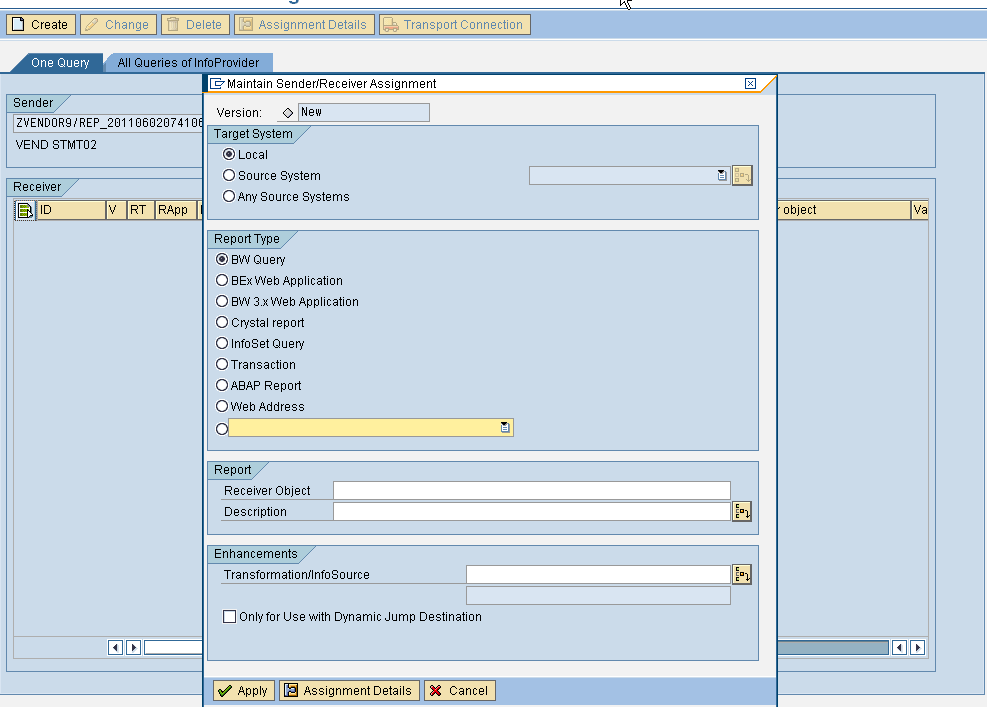
Select BW query and Recciver objects “Select which query who want to jump“.and click on Apply.
Click on Assignment details and click on save.
Variables:
Variables are query parameters that are defining query designer that are filled with values when you excute the query.
Types of variables:
1.characteristic variable
2.Hierarchy variable
3.Hierarchy node variable
4.Text variable
5.Formula variable
Processing Types:
1. User entry or Default values
2.Replacement path
3.customer exit
4.SAP exit
5.Authorization
Variable Entry
1.optional
2.mandatory
3.Mandatory intial values not allow
Variable represents
1.single value
2.Multiple single value
3.Intervals
4.selection option
5.Pre calculated value set
1.Characteristic variable:
1. Open a query designer
2.Select your query via your info area.
3. Drag and drop Material in to characteristic restiction panel
Material
Right click


Select variable
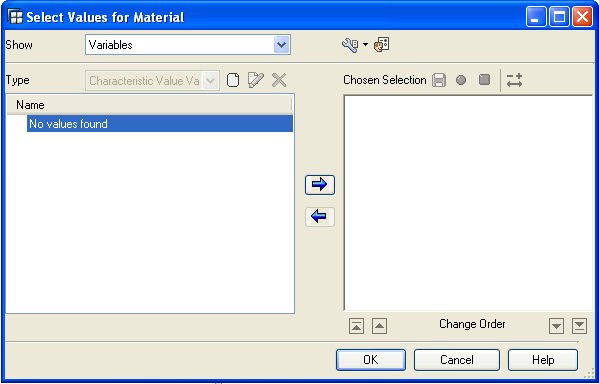
Click on create icon
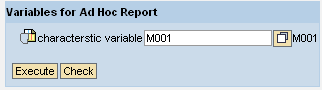
Enter description of variable and technical name and processing type manual/default.
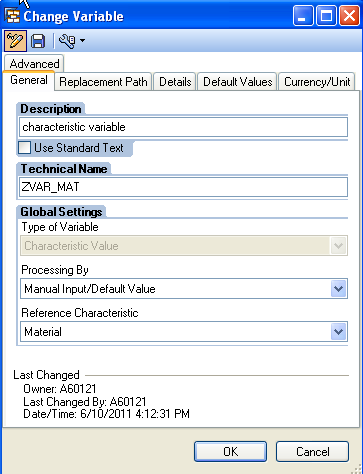

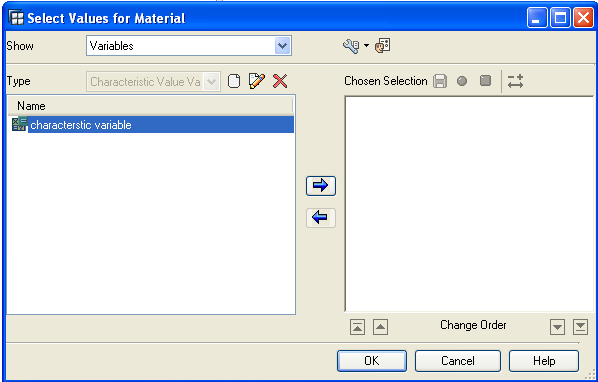
Click on that variable and transfer to right panel and click ok
Open rsrt and execute the query.
Variables are parameters of a query that are set in the query definition and are not filled with values (processed) until the query is inserted into a workbook. They function as a store for characteristic values and can be processed using the processing types Manual entry / Default value, Customer Exit or SAP Exit. The processing type Replacement path does not provide variables for characteristic values. The use of variables or texts is offered in conjunction with the use of variables for characteristic values
If you enter a variable for a characteristic value, for example, you do not have to fix the text for the characteristic value straight away, but can fill the field dynamically according to the characteristic that is used for the variable when inserting the query into the workbook. Define a text variable with automatic replacement for this.
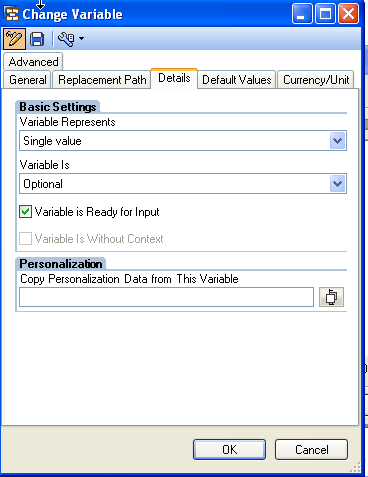
If one or more values of a characteristic are not to be entered fixed in the query definition, then you need a variable for characteristic values. A characteristic value variable can either be the store for a single value, for an interval or for selection options. Characteristic value variables for intervals and selection options are available in the processing type Manual Entry / Default Value.
Text variables of type Replacement Path:
This is possible to use text variables in order to handle dynamically the descriptions of formulas and selections in the query designer. This is useful, for instance, when you are using date restrictions in your query and you want to show the values listed by these restrictions in the query result. Below you will find some screenshots of a simple example:
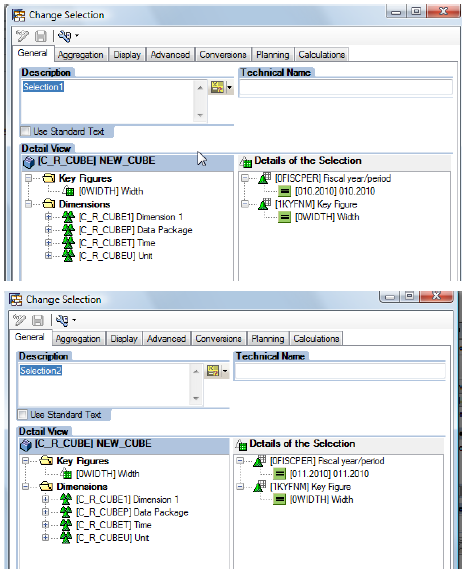
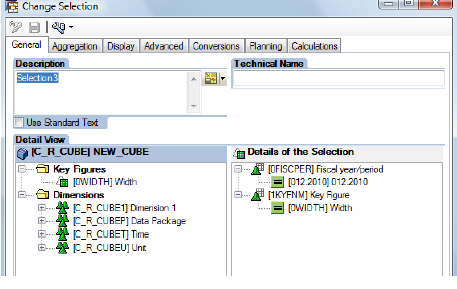
You have created a query with 3 selections where the characteristic 0FISCPER is restricted by 3 different months as per below.

Next 3 figures show the details for each selection, where the characteristic 0FISCPER has been restricted by values 010.2010 for selection 1, 011.2010 for selection 2 and 012.2010 for selection3:
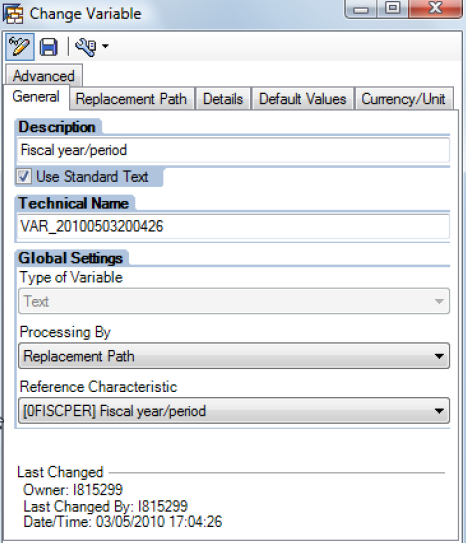
In the selection definition, field “Description”, create a new text variable:


In the next screen, you inform the “Processing By” as “Replacement Path” and the reference characteristic which you want to replace the information (that is 0FISCPER in our example). The Technical name is automatically suggested by system and it can be edited if necessary (VAR_20100503200426 in this example):
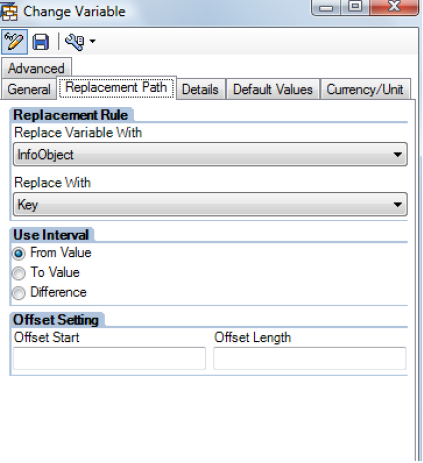
In the tab “Replacement Path” you need to inform with query object you want to replace the information (infoobject or variable) and also with data from that object should be used for replace. In our example it will be informed as Infoobject and Key respectively. You can find more information regarding the fields from that tab in the online documentation informed in item “Replacement Path Tab” of this document.
After save the new variable, it is going to be available and can be informed in the description field of our selections, as in figure below (if you enter that manually, this will require the tag “&” before and after thetechnical name of the variable):

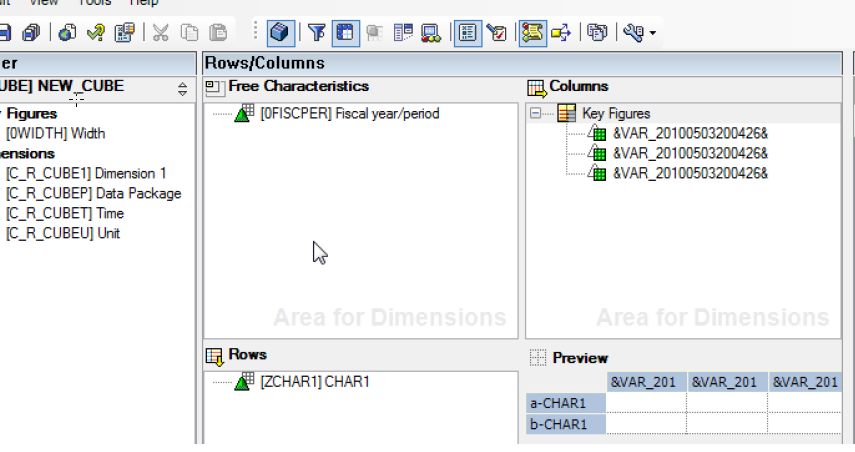
Now, using the text variable type replacement path, the result is that the description for each selection is going to be replaced by the value from which 0FISCPER has been restricted in that selection, as you cansee in the figure below:
So, the presentation of data using this feature is more understandable. It also can be dynamically handled in case you restrict you characteristic by a variable in the selections.
Formula variable:
Create a New Calculated Key Figure
The first step is to create a New Calculated Key figure for the Number of Documents/Orders.
Open Query Designer.
Create a new query or open an existing Query.
Drag and drop the required Characteristics and Key figures to the rows and columns depending on your business-reporting requirement.
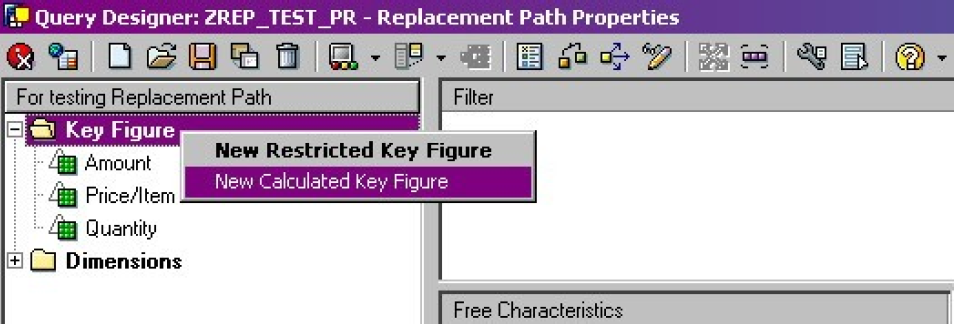
From the context menu of the Key Figure directory, choose New Calculated Key Figure.
Provide a description, for example Number of Documents/Orders.
The next step is creating a formula variable for getting the document count.
From the context menu for the Formula Variable, choose New Variable.

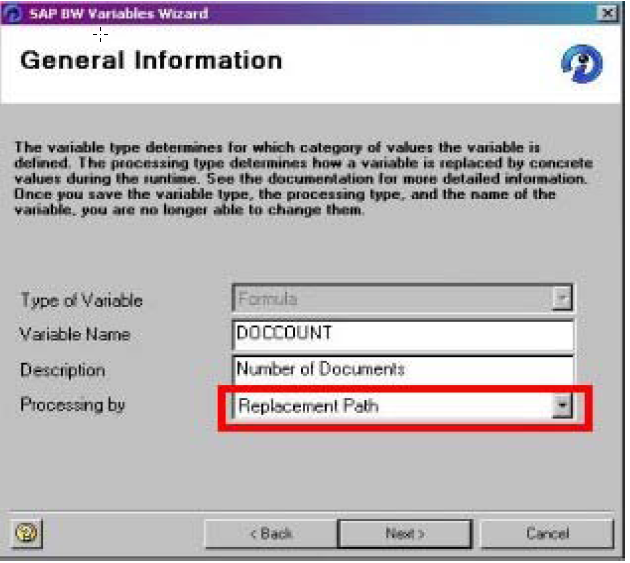
Provide the technical name and description for the variable.
Choose the Processing type as Replacement Path.
In the next screen, select the Characteristic Info Object based on which the number of documents is to be displayed in the report (For example: Document Number / Order Number.
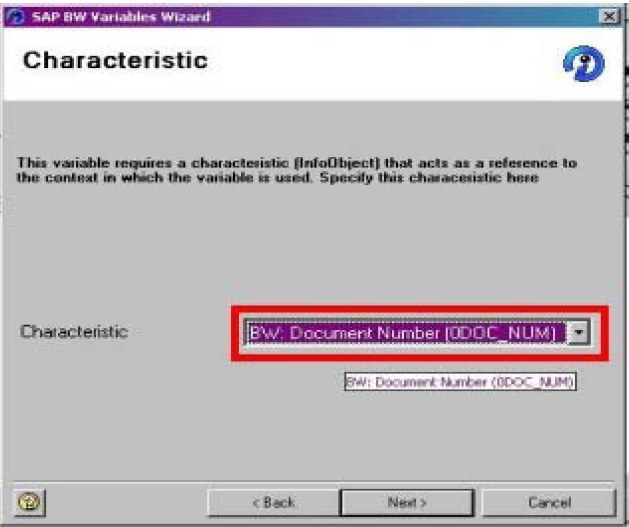
Choose Next.
In the Replace Variable with drop down box, choose Attribute Value.
In the Attribute drop down, select Characteristic Reference (Constant 1).
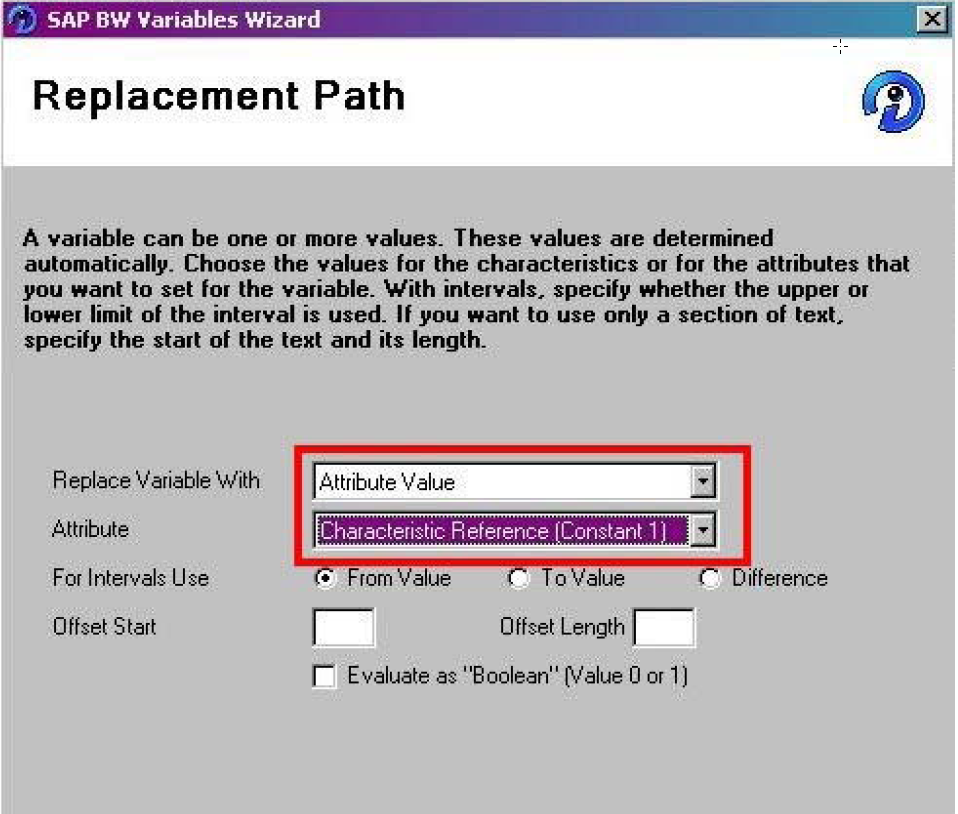
Choose Next.
On the Save Variable page, an overview of the settings made for the variable will be displayed.
Confirm the entries and Choose Finish.
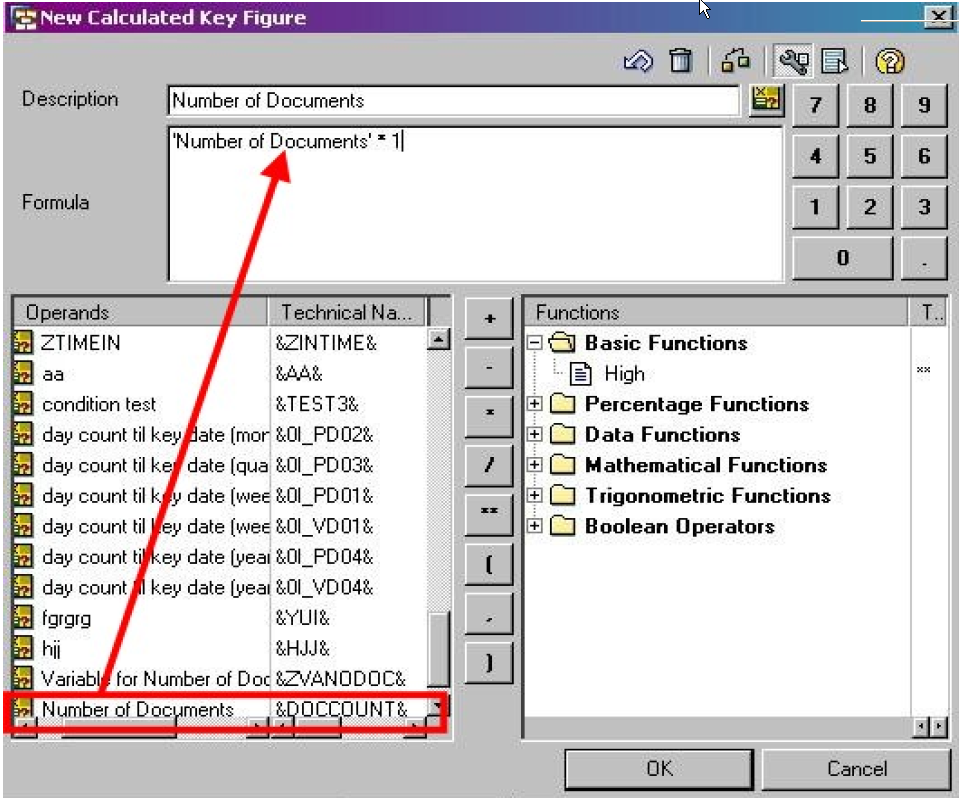
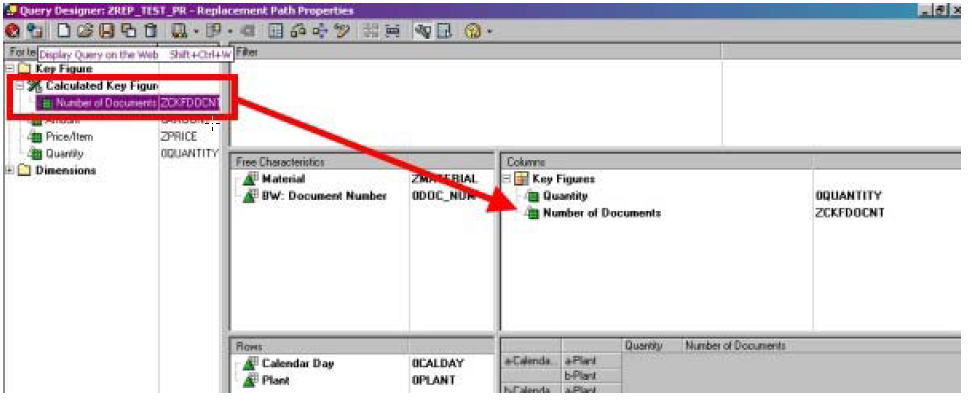
Open the formula variables directory and use Drag & Drop to transfer the formula variable as shown in the screen shot.
If the Formula variable is directly assigned to the Calculated Key Figure, a warning Calculated Key Figure is not defined correctly will be displayed while executing the Query.
To avoid the warning message, the formula variable is multiplied by 1 as shown in the screen shot.
Choose OK.
In the Properties of Calculated Key Figure dialog box, assign a Technical name for the CKF.
Set the number of Decimal placed to 0.
The most important step here is to set the Time of Calculation to After Aggregation.
Then only the total Number of Documents/Orders will be displayed correctly in the report.
If it’s set to Before aggregation, when an existing document is changed in the source and data is loaded to the cube using a new delta request, the document count will be displayed as two instead of one.
By Default the Time of Calculation is set to After Aggregation.


The new calculated key figure is available under Calculated Key Figure in the Key Figure directory, and can be included in the query definition using Drag & Drop as shown in the screen shot below.
You may have to include another Key Figure also in the definition; otherwise an error message will be displayed in the query. If you don’t want to display the newly added key figure in the report, you can hide it by choosing Properties from context menu of the key figure and selecting the Hide option.
Save and Execute the Query.
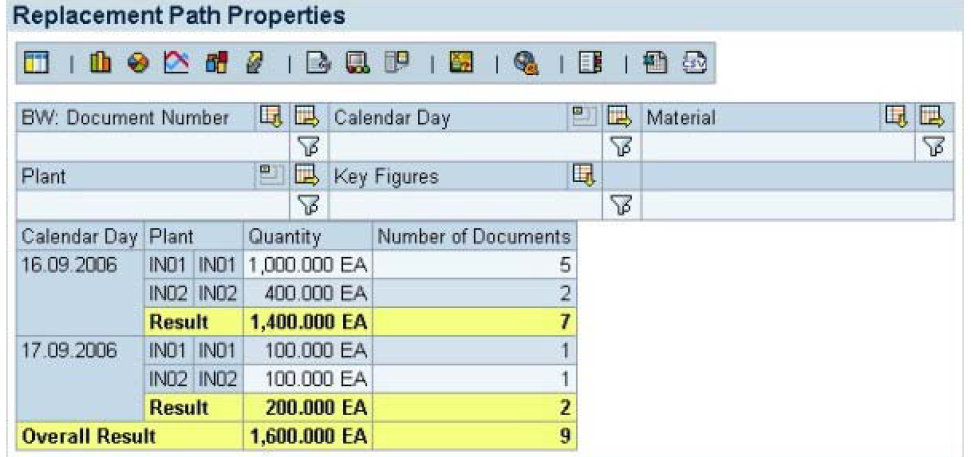
The sample report shown here displays the total number of Documents/Orders for each plant on a daily basis.
Important Tables Used in Reporting
RSZELTDIR - Directory of the reporting component elements
RSZELTTXT - Texts of reporting component elements
RSZELTXREF - Directory of query element references
RSRREPDIR - Directory of all reports (Query GENUNIID)
RSZCOMPDIR - Directory of reporting components
RSZRANGE - Selection specification for an element
RSZSELECT - Selection properties of an element
RSZELTDIR - Directory of the reporting component elements
RSZCOMPIC - Assignment reuseable component <-> InfoCube
RSZELTPRIO - Priorities with element collisions
RSZELTPROP - Element properties (settings)
RSZELTATTR - Attribute selection per dimension element
RSZCALC - Definition of a formula element
RSZCEL - Query Designer: Directory of Cells
RSZGLOBV - Global Variables in Reporting
RSZCHANGES Change history of reporting components
RSZCOMPDIR IS THE ONLY TABLE WHICH PROVIDES THE DATA