
Performance Improvement Measures in BI
Purpose of the document:
The performance aspects of a BI project should be of primary consideration, so to provide and to overcome performance hurdles this document describes best scenario for that.
Introduction
The performance aspects of a BI project should be of primary consideration, as performance is directly related to the disagree of user acceptance of the solutionand it may result reports running slow, hanging which directly impact the user,it also impact batch loads result in delay of Business normal working hours.
Table of Contents
A) Aggregates
- Aggregates
Aggregates are subset of basic cubes; they are generally used to accelerate the response time of query. During query execution, if applicable, an aggregate is hit before the Info Cube, and this serves to improve performance.
Aggregates are built only for basic cubes not for any other cube.
How to build up aggregate for particular cube: Example shown below
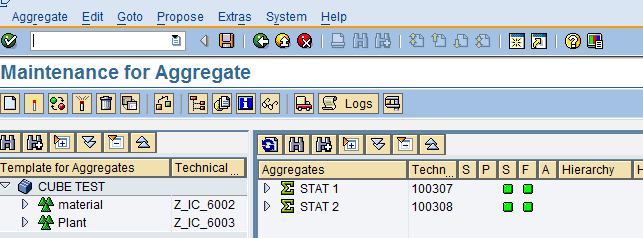
Right click on desired cube then select ―Maintain Aggregates‖
Cube Name: Z_IC_600

On clicking maintain aggregates you will get the below screen.
This example shows how to build aggregates by using system statistics.

Once clicking it will be navigated to below screen.
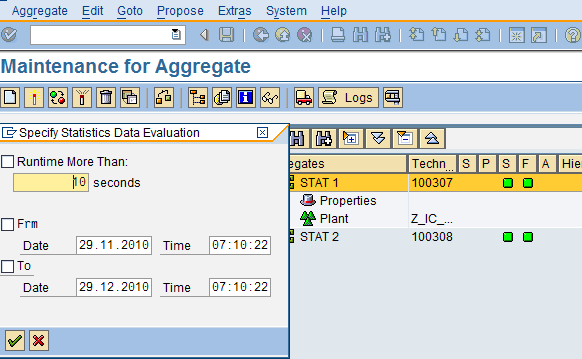
Note: Similarly one can create proposals from query user statistics, for this number of queries need to execute to gather in order to get the desired result.
Generally an info Cube contain more than one aggregate, but once when aggregate is hit for each query step and priority of aggregate is decided by OLAP processor
- Step to set up of read mode:
Read mode determines the manner in which data are returned by the OLAP processor when you execute a query.
SAP provides 3 read options:
- H mode: Read query when you read or expand hierarchies. In H mode the detailed information within the nodes and sub nodes of hierarchies are readed
- X mode: Query read data during navigation, in this mode data is requested by each navigational step.
- A mode: There is only read process in this mode, so it read all data at once.
Go to transaction RSDIPROP; specify the info provider name and change.
In This case we specified Cube name: Z_IC_600.

On clicking change icon will be getting the below screen, from where one can select any of the read modes from drop down option.
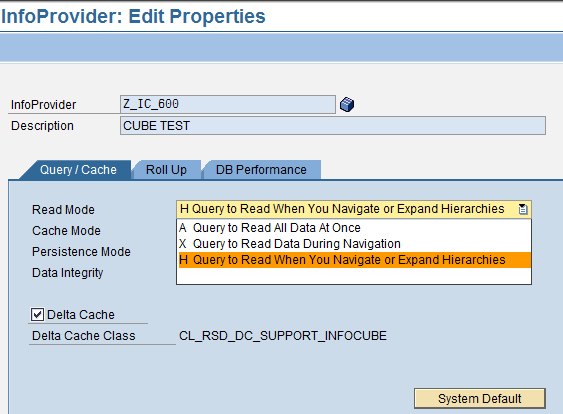
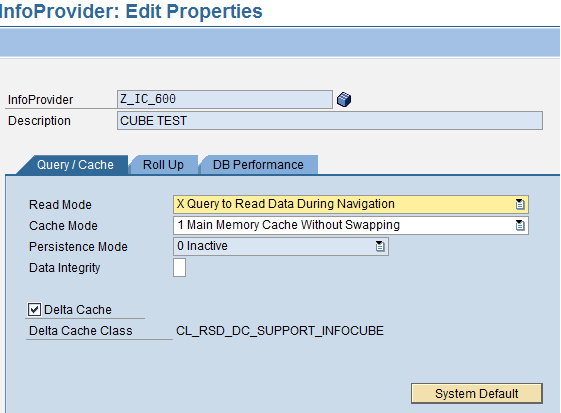
one can select any of the three read mode depends upon the analyzing needs.
C) T code: ST03 for Workload monitoring
Go to T code: ST03 select expert mode
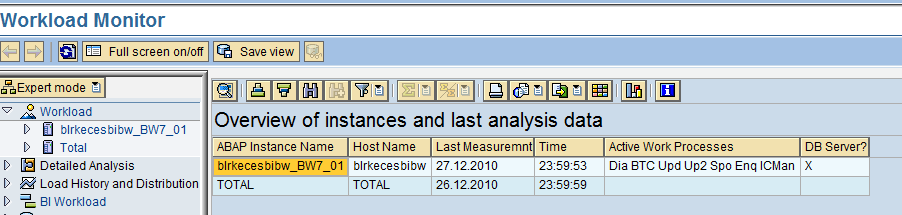
This T code provides various options which can be explore for detailed Analysis
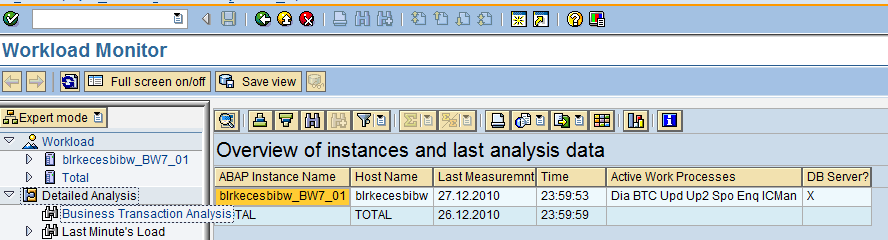
One can perform a very precise analysis of individual transactions here
On double clicking Business transaction Analysis get below screen
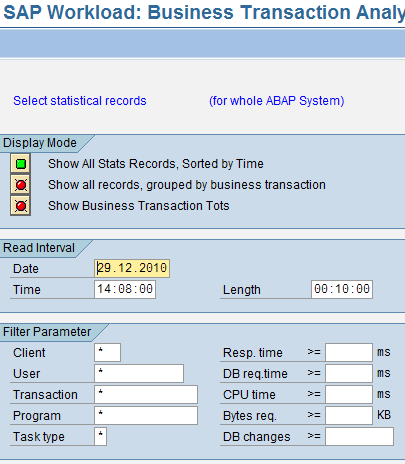
In filter parameter under Transaction, mention any relevant T code and system wise analysis of that
T code can be done.
T code can be done.

On entering Tcode analysis can be done like CPU usage etc..

Similarly under Collector and Performance Database, here one can make settings about which workload data the statistics collector determines, and how often, and how long it should be retained at what level of detail in the performance database.
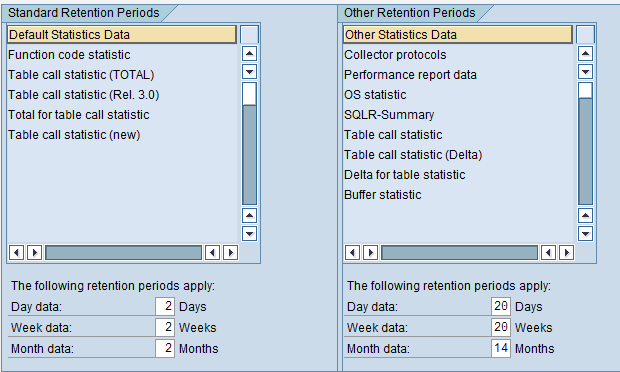
In the above screen under retention period you can set the retention period.
The purpose of enabling the collector to collect as much as possible of the relevant data for you while using as small an amount of system resources as possible. You can view the log of the workload collector to help you find errors