
Structures & Cell Definition
Cell definition
Scenario:
In the sales report we want to show the incentive earned by a salesman. Whenever a salesman sells any product he will get some incentive, the incentive will depend on the product sold by him and the incentive will change for each product sold by the salesman. For example we have 2 products, Product A and Product B. When the salesman sells Product A, he should get an incentive of 4% on the sale of that product and when he sells Product B then the salesman should get an incentive of 8% on the sale of that product. That means depending on the Products sold by the salesman the % of the incentive is going to change.
When this Report is executed, It will also contain the column “salesman incentive” showing the incentive earned by the salesman based on the products sold by him. The incentive of the salesman will change based on the products sold by him.
We will calculate the incentive earned by the salesman depending on the cost of the Product and the % of incentive on that Product.
Step By Step Procedure:
→Create a data target with Product ID, Salesman ID and Calendar Day as key fields and Product Cost, Quantity Sold, Incentive Percentage and Calendar Year/Month in the data fields.
*We have taken Calendar Year/Month to get the monthly salesman incentive details.

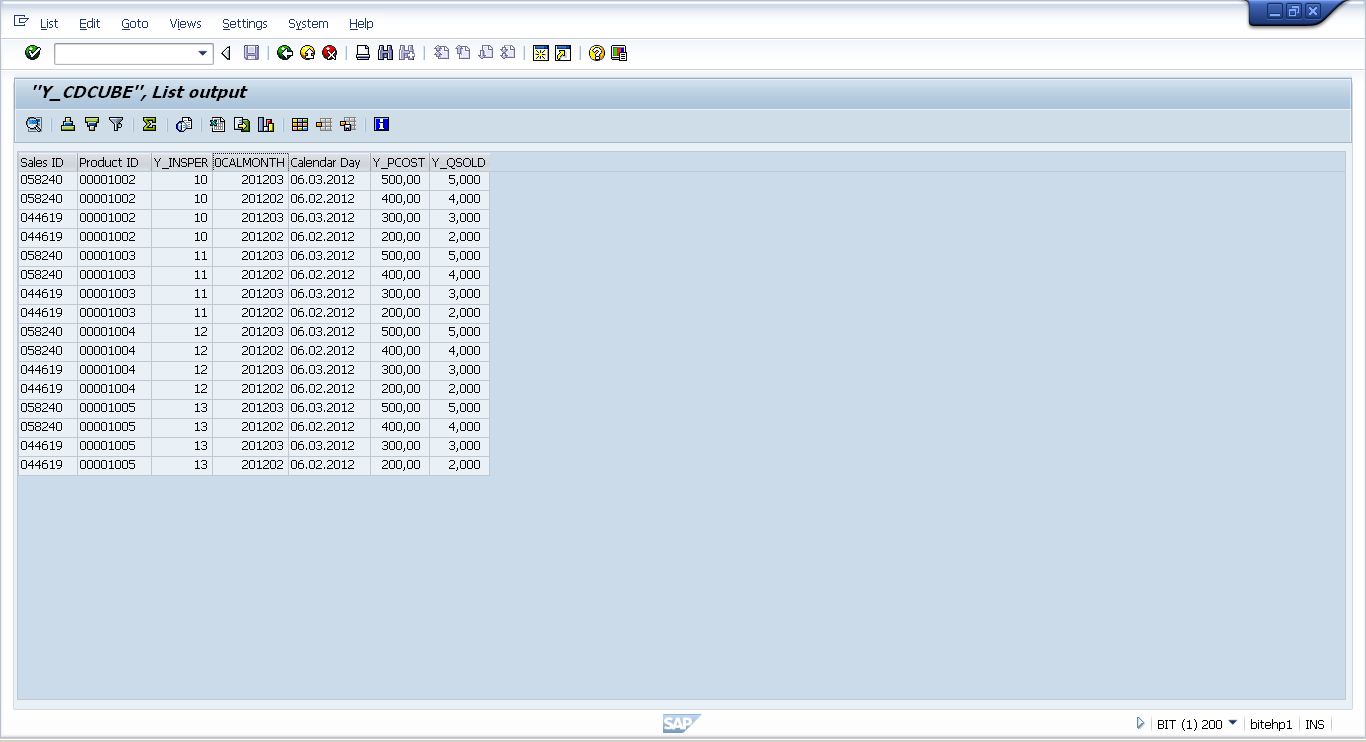
→Load data into the sales data target, this data can be viewed in the active data table of the DSO. Here we can see that the Incentive Percentage changes for each Product. Now based on this data we need to calculate the Incentive earned by the salesman.
→Create a Query based on the sales data target
Go to the Query designer and create a Query based on the cube created. Based on our scenario lets take the Salesman ID, Product ID and the Incentive Percentage in the Rows and Product Cost and Quantity sold in the Columns.
Pre requisites: The query must contain 2 structures, one in rows and the other in columns. Then only we can define cells. Once this is done the “Define cells” option will be enabled.


→To calculate the incentive earned by the salesman we are going to use the formula:
{(Product Cost * Quantity Sold) * (Incentive Percentage / 100)}.
*If we directly try to create a formula in the cell definition then we will not be able to use all the required fields for the calculation. So here we will go with the option “Help Cells”.

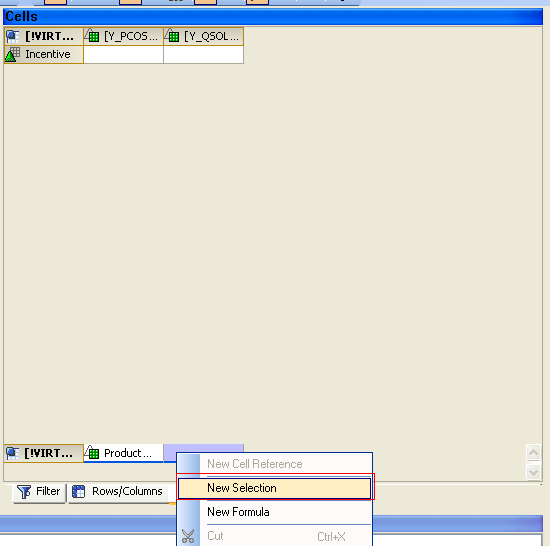
→Using this “HELP CELL” option, we can create additional cells using “new selection” and “new formula”. In order to calculate incentive of a sales man, we use this formula:
{(Product Cost * Quantity Sold) * (Incentive Percentage / 100)}.
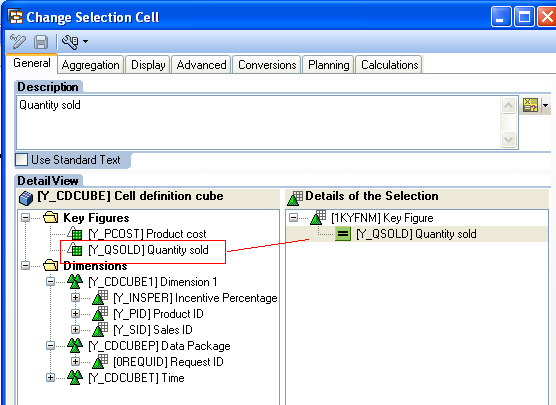
*For this we require total cost (where total cost = Product cost * quantity sold), so we define 2 new selections for Product cost and quantity sold, and new formula for Total cost:

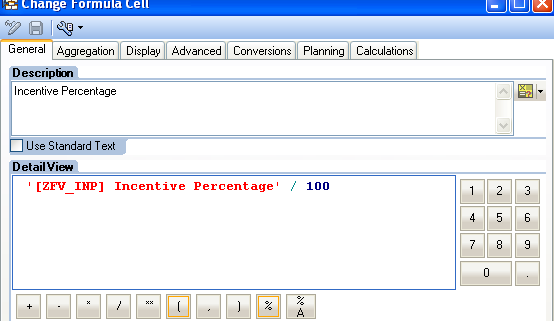
→To calculate the incentive %, we have to create a formula variable with replacement path, as the incentive percentage is characteristic we will not be able to use directly in the formula.

*Formula: Incentive Percentage = (Incentive Percentage / 100)
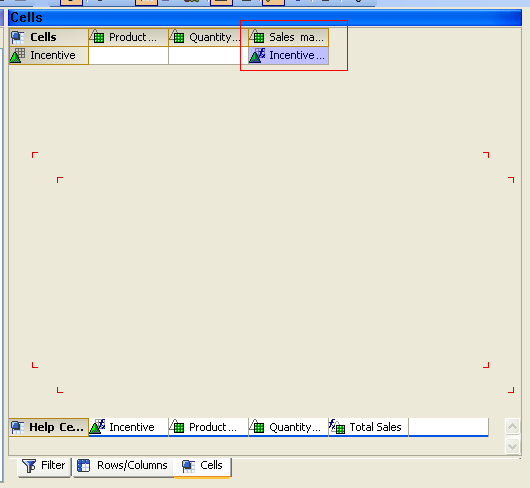
→Now, all the required help cells were defined.

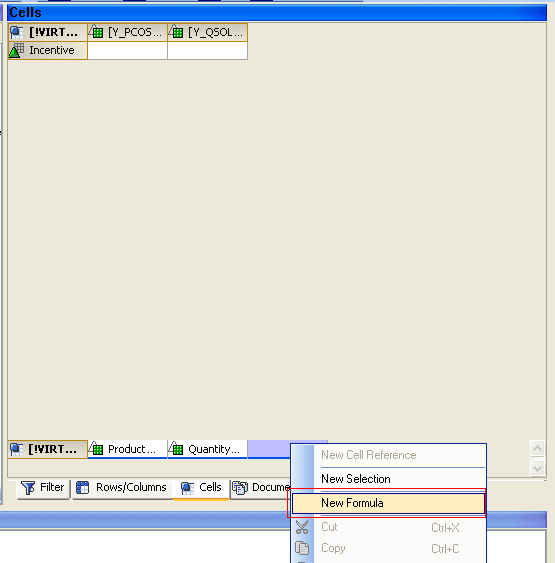
→We need to take a new selection for the Key Figure, this will act as the column to display the Salesman Incentive.

→Now goto the function “Define Cells”, here we will create a formula to calculate the Salesman Incentive. Right click on the new column and select “New Formula”.

Formula to calculate Salesman Incentive:
*Formula: Salesman Incentive = (Total Sales * Incentive Percentage)

→The final cell definition:
→Now save and execute the query:
*NOTE*: In the last column i.e. for Sales man incentive, we can see the amount value getting changed based on the product ID.

****************