Production Support Issues and their Resolutions
Important Transactions Codes
RSMO – Load Monitor
RSPC – Process Chain Maintenance
RSPCM – Process Chain Monitoring
BWCCMS – Process Chain Monitoring
SM12 – Display and Delete Locks
SM37 – Job Selection
SM50 – Process Overview
SM51 – List of SAP Systems
SM58 – Asynchronous RFC Error Log
SMQ1 – qRFC Monitor (Outbound Queue)
SMQ2 – qRFC Monitor (Inbound Queue)
RSRQ – Data Load Monitor for a request
ST03/ST03N – Work Load Monitor
ST05 – Performance Monitor
ST22 – ABAP Dump Analysis
AL11 – Display SAP Directories
BD87 – Status Monitor for ALE Messages
OB08 – C FI Maintain Table TCURR
SAP BW Monitoring Tool
1. Go to SE38 and execute the BW Tools monitor program.”/SSA/BWT”
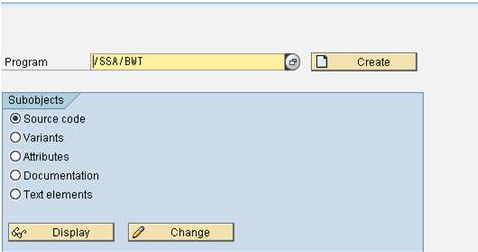
OR
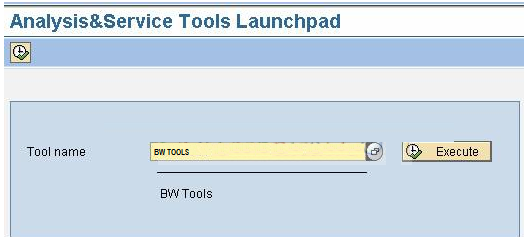
Go to Tcode – ST13 and give “BW_TOOLS” in the screen screen and execute
2. In the next screen, select “Process Chain Analysis” and execute
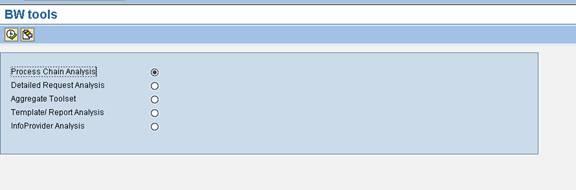
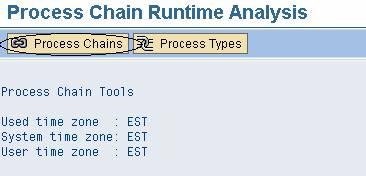
3. In the next screen select “Process Chains” Icon.
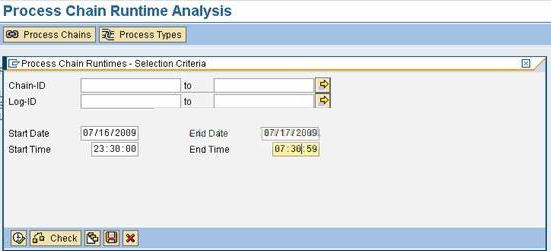
4. In the next screen, Please give the start date & end date and time and execute.
We can give 23:30 EST to 7:00 EST to cover the entire nightly batch PCs
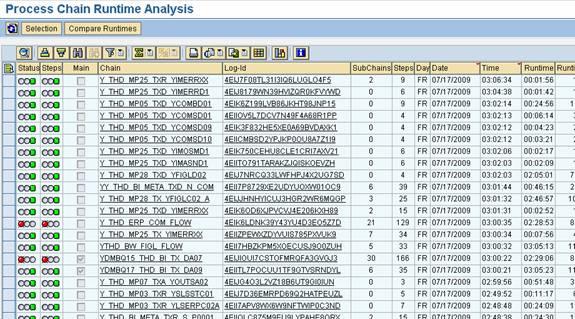
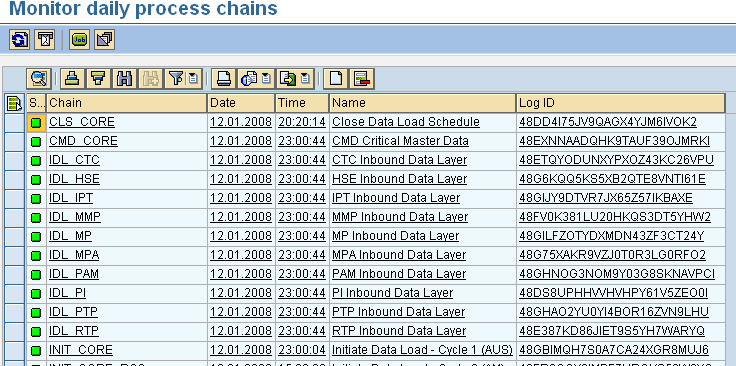
5. From here you can see all the chains that ran/running in this time frame and it shows the status of these chains too. From here you can see which chains are completed, their runtimes, which chains failed, where it failed. You can see the status on meta-chain level here and not in the overall chain-level., hence its easy to monitor the chains/loads
7. When we click any metachain, it will show the different processes within the chain & also shows where a load/index creation job failed and also it gives the individual runtimes – can be used for loads performance tuning.
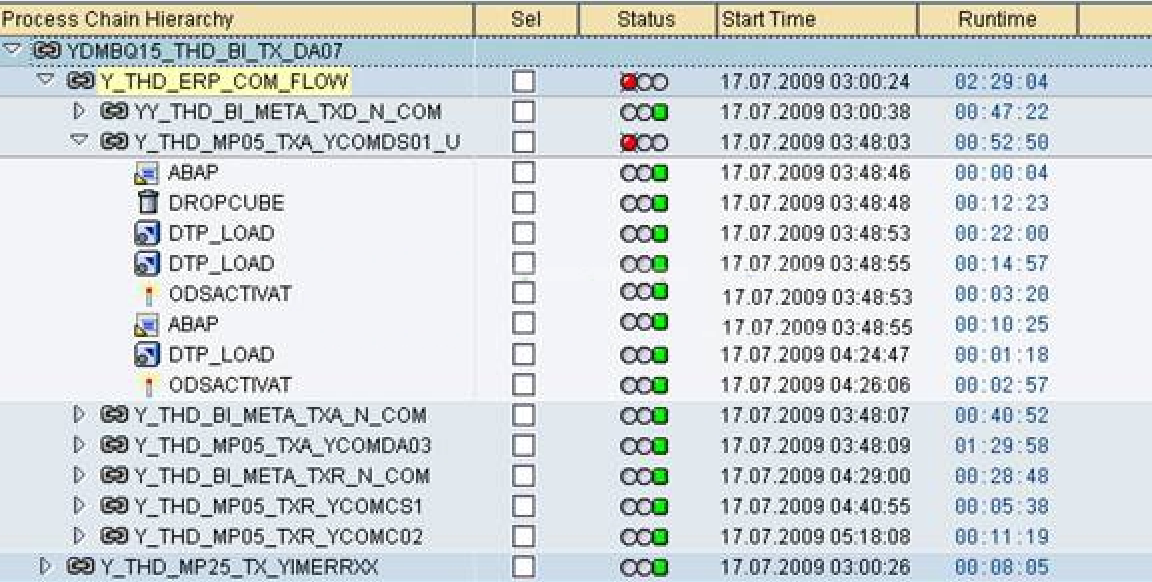
8. Also, from this screen, we can navigate to individual chains and check for issues directly.
Hence using this functionality - we can monitor all loads from one-point. [AD]
Three load cycles per 24 hours at end state
Due to the various time zones across Rio Tinto’s Business Units and a commitment to deliver data overnight for the specific users, it is expected that three load cycles are needed at end state. The concepts implemented should allow a number of runs for each calendar day.
Monitoring Tools or Functions
These tools are the most common tools being used to perform tasks during monitoring.
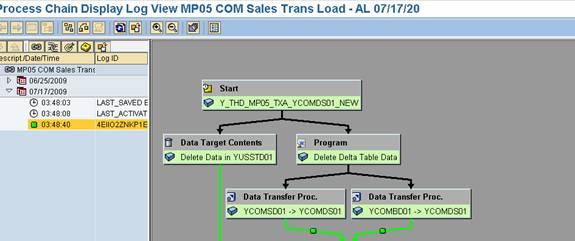
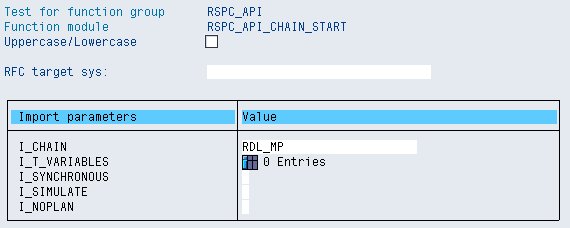
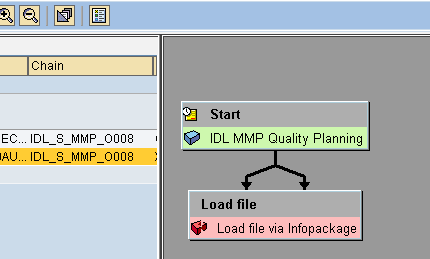
Executing Process Chain including sub process chains manually
System: BWP
Transaction Code: SE37
Function Module: RSPC_API_CHAIN_START
*Here RDL_MP is name of the process chain used
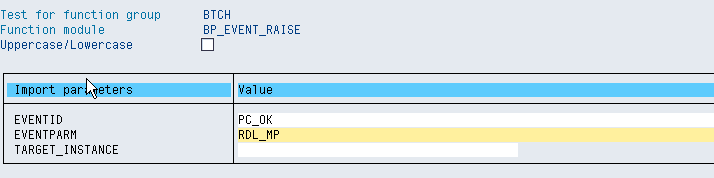
Raising Events/Interrupts manually
System: BWP
Transaction Code: SE37
Function Module: BP_EVENT_RAISE
Warning! These activities must be executed only when necessary, else data consistency may be affected
Data Load Monitor Overview
System: BWP
Transaction Code: RSPCM
Common Data Load Errors
This section describes the most common data load errors and steps taken to rectify them. Please be noted that it is common that every error could be caused by multiple factors. Therefore, the steps below may not resolve the error as intended.
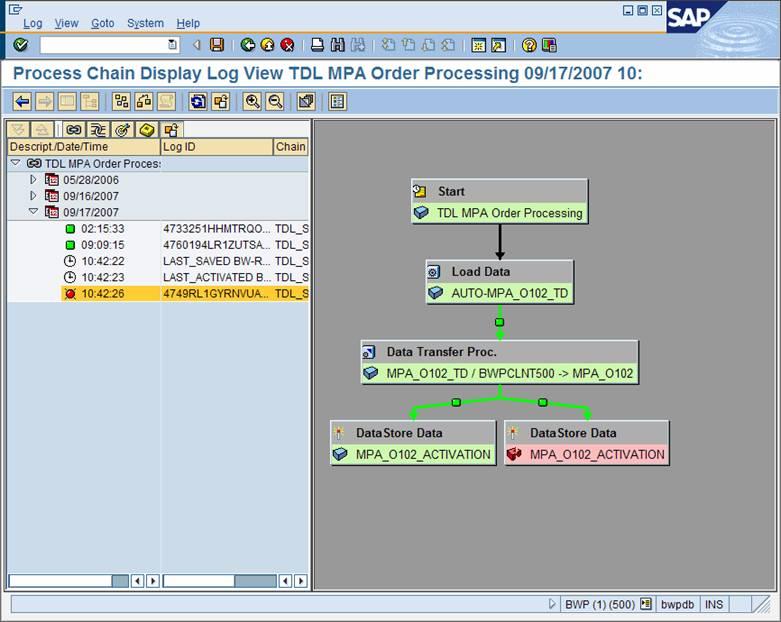
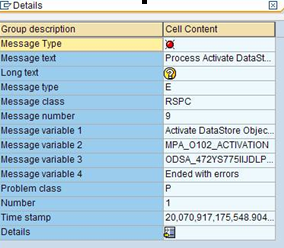
Data Store Object Activation Failure
Symptoms: If ODS activation fails, ensure you review the activation logs as shown below
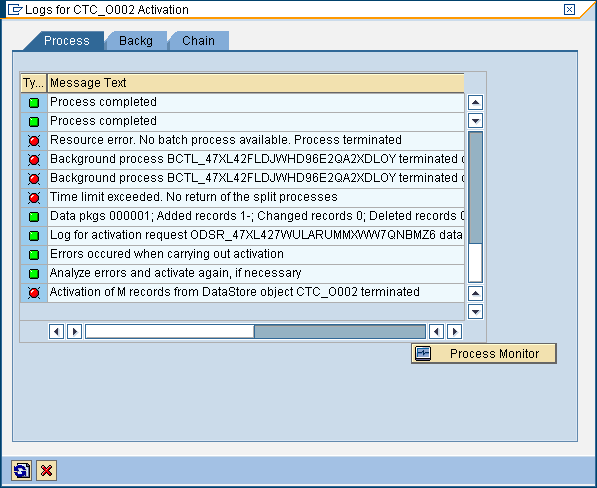
Error Message: Resource Error. No batch process available.
Solution: Wait for 5 to 10 M & REPEAT the erroneous process
Range of statement is too wide
Symptoms: When the DTP fails with error messages saying the range of the statement to be passed to the database is too wide
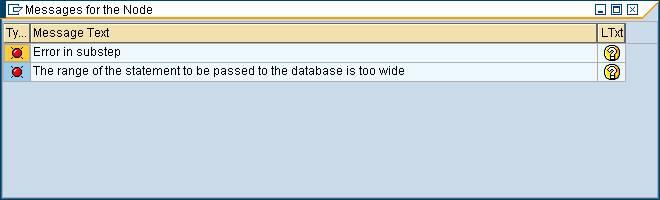

Solution: To try to resolve this issue, change the data packet size of the DTP as shown below to smaller size.

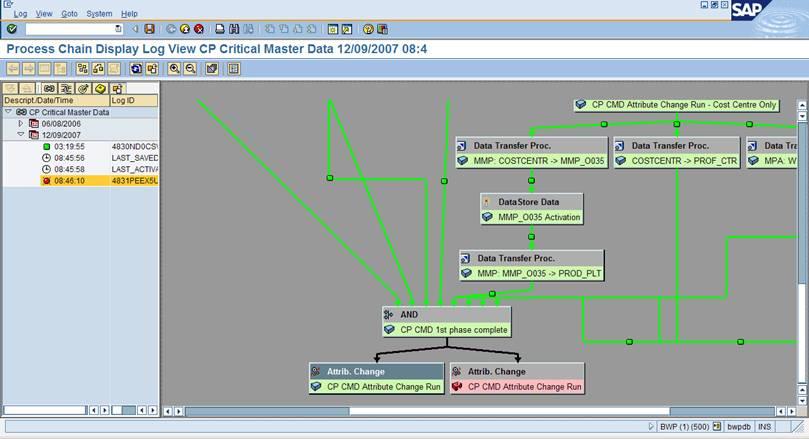
Attribute Change Run Failure
Symptoms: Attribute change run fails with no proper details.
Solutions: This can be resolve with the steps below.
Option 1: Perform a repeat from the process chain (right click on the process type and select repeat)
Option 2: Execute the Attribute Change Run after selecting appropriate infoobject in RSA1 and run manually step by step as shown below

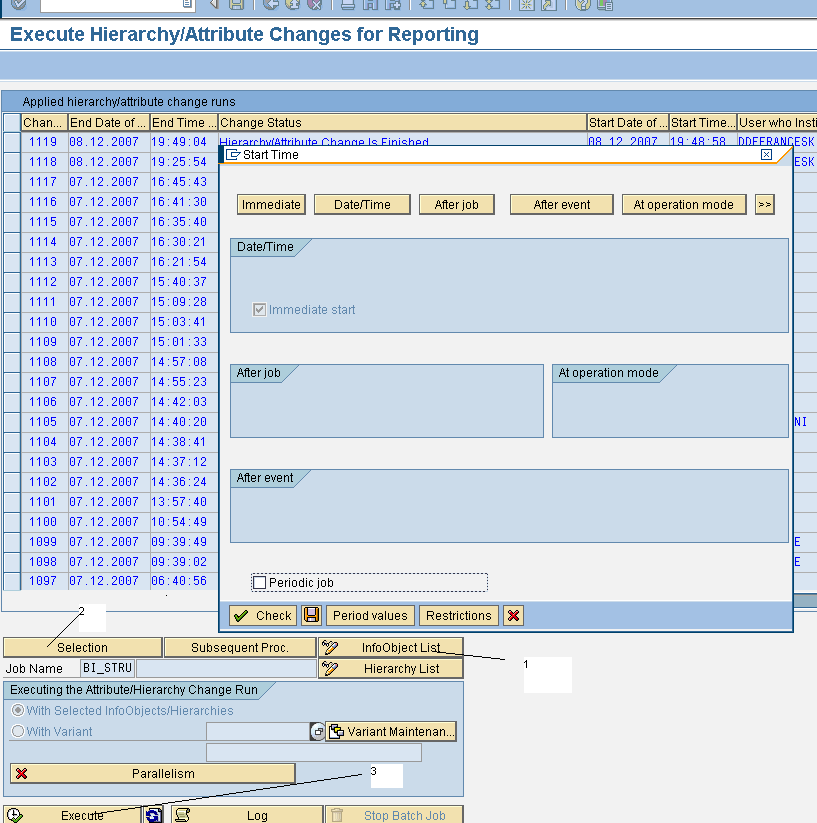
- Click on infoobject list to select objects to be activated
- Selection - Click selection and the following pop up window opens.
Select immediate save
- Execute - Click on execute button.
Note: In order to continue from the process chain, go back to the process chain and Right click on failure Attribute chain and Repeat.
2.4. TRFC Struck
Symptoms: The error happens during extraction using infopackages. The symptoms include data load is not running or performing as usual. This RFC stuck issue can be identified mostly by looking at the infopackage monitor for the current load.
RFC would normally do not stuck if the Data Request Received and Data Selection Scheduled have completed with status green under the Details tab of the monitor. If either of these is yellow as shown below it is quite indefinite that there are RFC being stuck.
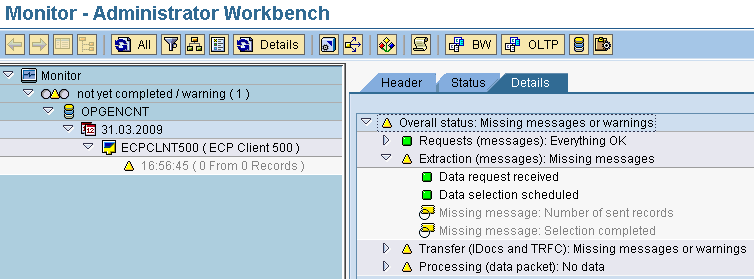
This issue could happen in either BW or ECC system although normally it happens with extraction from ECC.
Solution: To check or confirm whether it is due to the RFC stuck, log into ECC system, go to T-code SM58.
Enter the selection screen values as below for user and date as default value
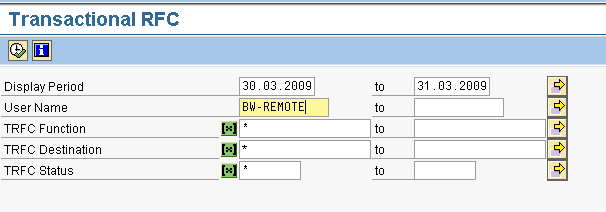
If you see there is a long list of idocs, then this probably indicate that there are some communication problem and thus means IDOCs or RFC is stuck.
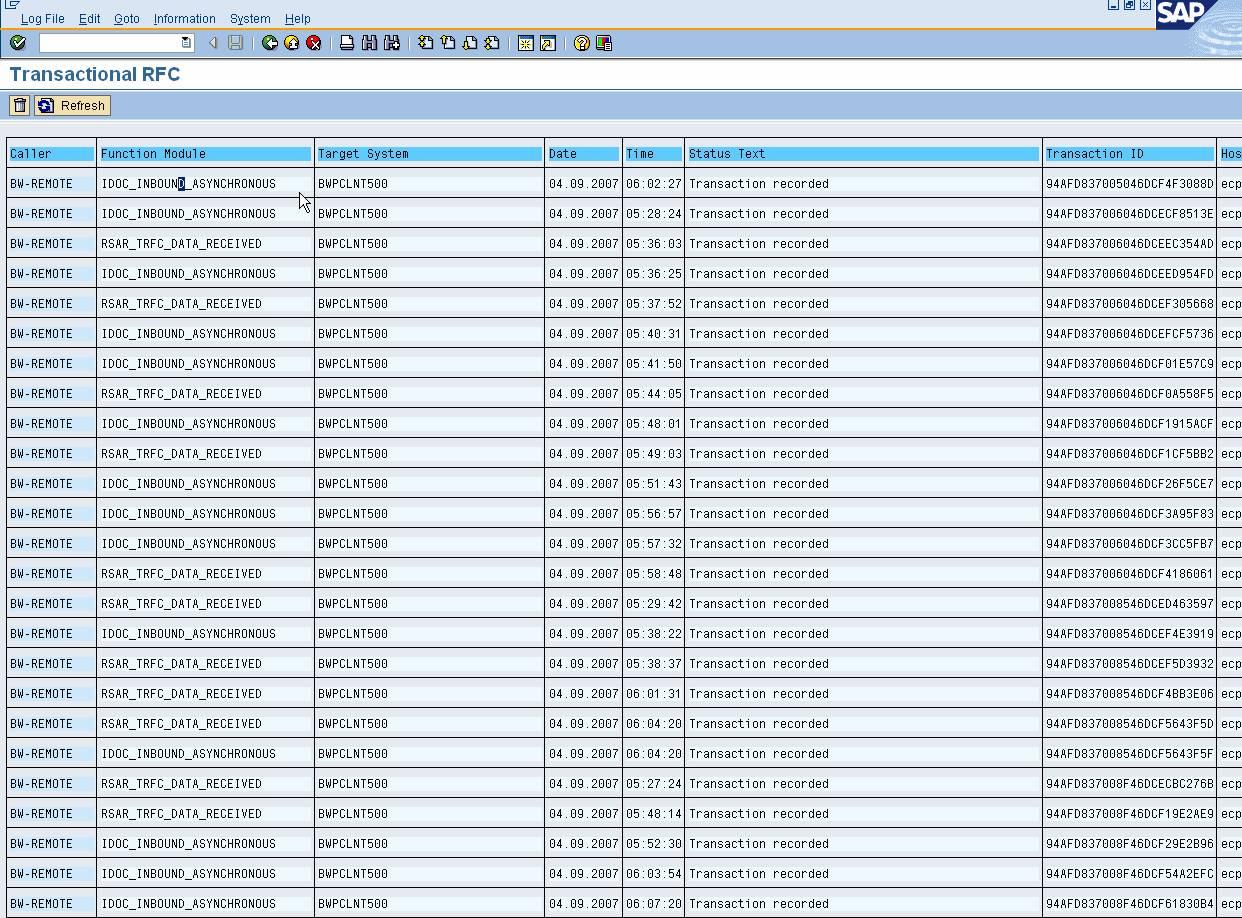
If this is true, send an URGENT mail to Basis team to look into the issue. Indicate that it is suspected that the RFC is stuck.
Directory Invalid /SAPINTERFACE/BI_INBOX/MMP/
Error Message:
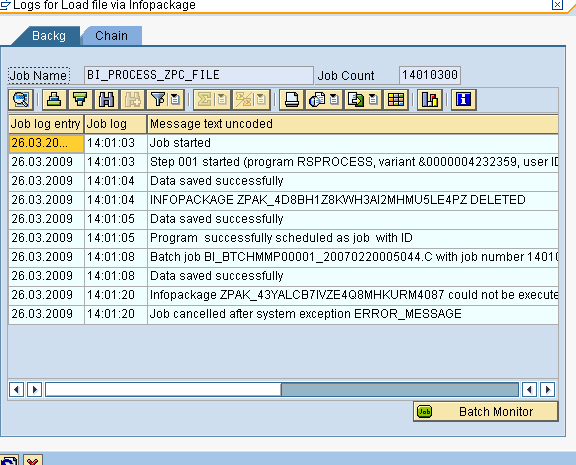

Solution: Send all these details to BASIS team to correct directory
2.6. Long Running DTP
Symptoms: If DTP is running more time than normal time or DTP struck, go to DTP process monitor and check any records were received, below it shows 0 records even after running 46 mins 26 Sec.
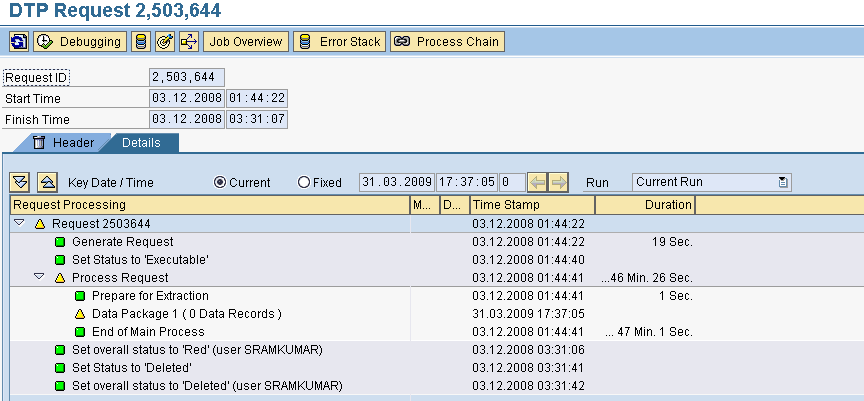
Resolution:
- Right Click on DTP and Go to Target Administration
- Manually make the status to red from yellow
- Delete the request from Target
- Go back to process chain and repeat the DTP (See below succeeded after 5 sec)
2.7. When DTP fails resulting in a short dump (ST22)
Whenever there is a failure in DTP and resulting in a short dump and short dump is of type Syntax Error. It’s worthwhile to check if
1. DTP used is active or not.
2. Transformations are active or not.
If DTP or Transformations are not active then it may result in the short dump.
Also in ST22 check the short dump wordings.
Short Dump error when DTP is executed.

Short Dump – ST22:

Solution: For these kind of problems solution is to activate DTP if it’s inactive and execute DTP.
If Transformations are inactive check if there is any transport effecting the Transformation if there are then re-import the transports and activate the Transformations.
DTP Fails when loading all RC_* master data (e.g. RC_PLANT/RC_COCODE)
Symptom: DTP load fails with error message master data records number for both RC* master data and original master data is not the same, OR error message with empty message.
Reasons: the reason for this is because there are number of records differences between the RC* master data value comparing to the original master data. Example as below
Solution:
We must always compare between P tables of two master data. Example /BIC/PRC_COCODE and /BIC/PCOMP_CODE.
Note: Please always take the original master data (/BIC/PCOMP_CODE) as primary reference and not any standard SPRO config table such as T001.
After the comparison, update/delete any missing/additional records into the RC master data. Save and activate the master data.
Rerun the DTP to ensure that the master data is successful.
Note: RC* -- Run Cycle
DTP ends with error, with message parallel settings is wrong

Solution: When log is analysed, it says the parallel settings is wrong. When this happens check the DTP settings if it is set to parallel loads if yes. Just reactivate the DTP manually. Execute the DTP manually. It will be successful. Then repair again in the process chain.
3.0. Infopackage failed with ‘Error occurred in the source system’
Symptoms: Infopackage failed due to “Error Occurred in the source system”. But the actual error message appears in Error Message tab. Here Infopackage failed due to production unit (Cost Ceiling) not maintained.
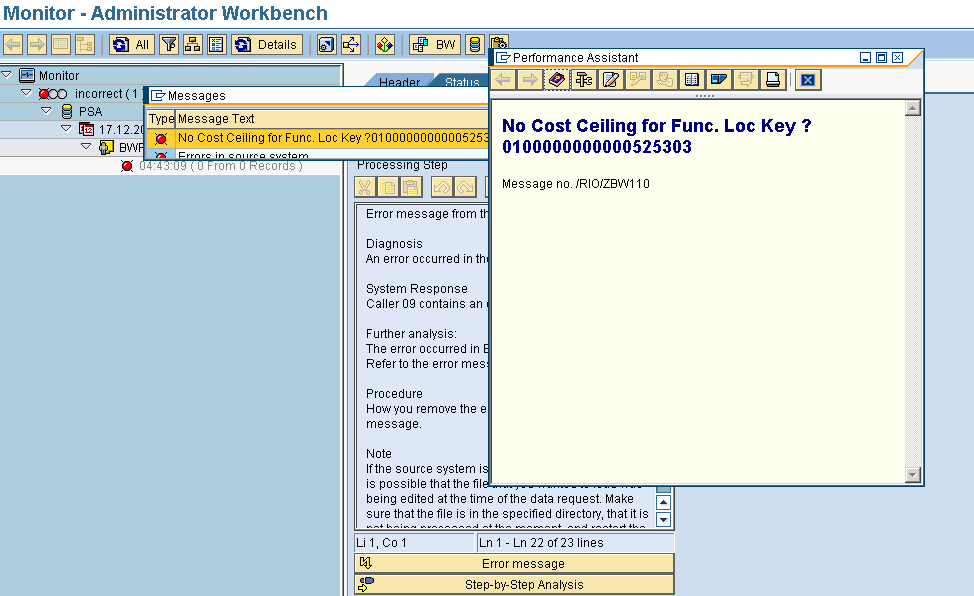
Resolution: Need to contact with source team to maintain production unit for this particulary key after changes happened in the system repeat the errornus Infopackage.
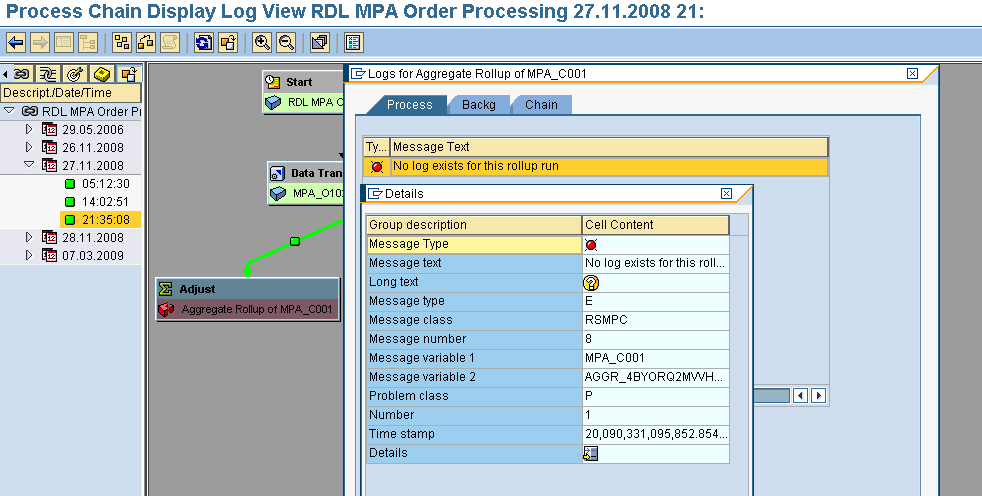
3.1. Aggregate Roll up ends with error
Symptoms: Aggregate rollup may failed due to locking issues (Here Aggregate Rollup failed due to Info Cube is locked by Chage run)
Resolution: Need to wait until cube gets released from locking issue and repeat the errornus Aggregate Rollup process to resolve this issue.
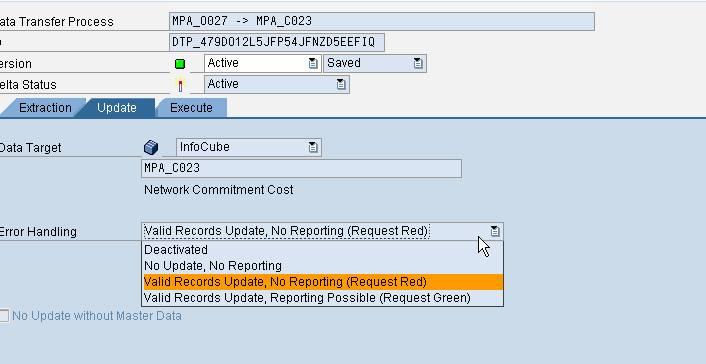
3.2. Creating or activating Error stack
Symptom
When we have problem with data such as foreign characters, we want to correct the erroneous data via error stack (in DTP monitor). However, when you click on the Error Stack, there is nothing or error message appears

Analysis & Solution
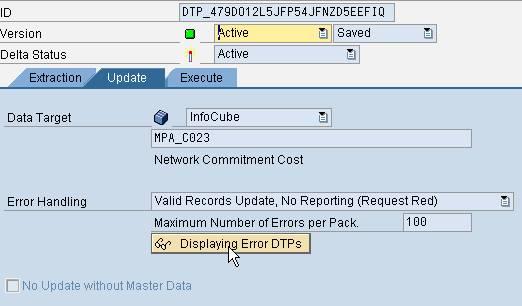
Reason being is because the DTP Error Handling settings is most probably not set to Valid Records Update, No Reporting (Request Red). In order for the Error Stack to be use and available, we must ensure the setting for the DTP is Valid Records Update, No Reporting (Request Red).
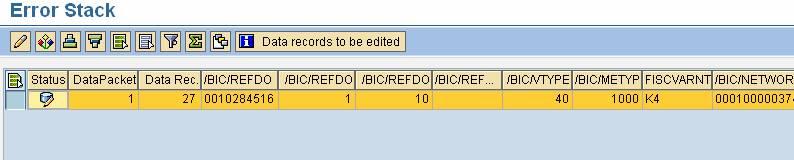
Edit the record in the error stack.
Step 1: Correct the Error Stack


Step 2: Save the corrected Error Stack
Step 3: in the normal DTP, go to Update tab, click on the DISPLAYING ERROR DTPs or CREATE ERROR DTP or CHANGE ERROR DTP. This depend on whether there is an existing error DTP.
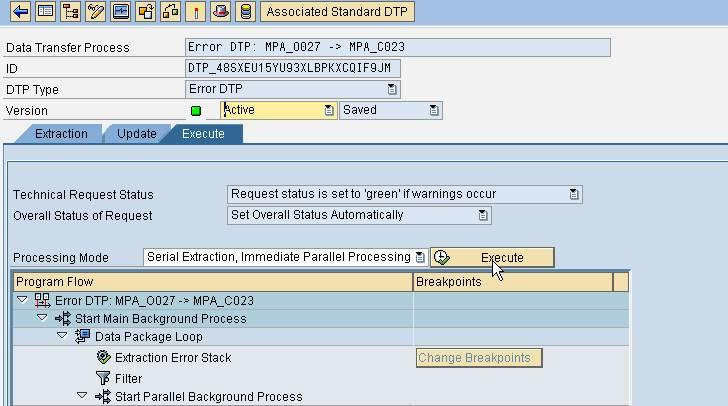
Step 4: Execute the Error DTP. This will update the Corrected Error Stack into the target cube
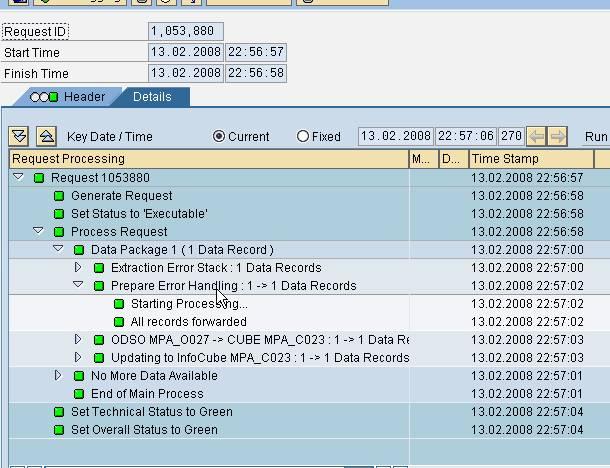
Step 5: You will see the earlier erroneous request and the Error DTP successful request in the manage cube
Step 6: Change the status of the Errorneous request from RED to GREEN manually

3.3. Infopackage failed with locking issues
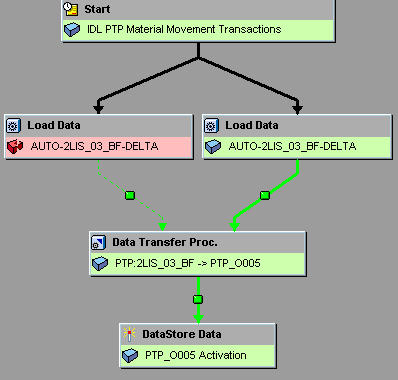
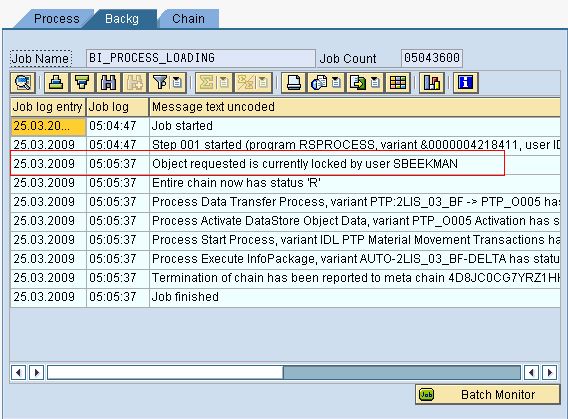
Resolution: This Infopackage is currently locked by user ‘SBEEKMAN’. Ask user to come out of Infopackage and once if he does rerun the Infopackage it will get succeeded.
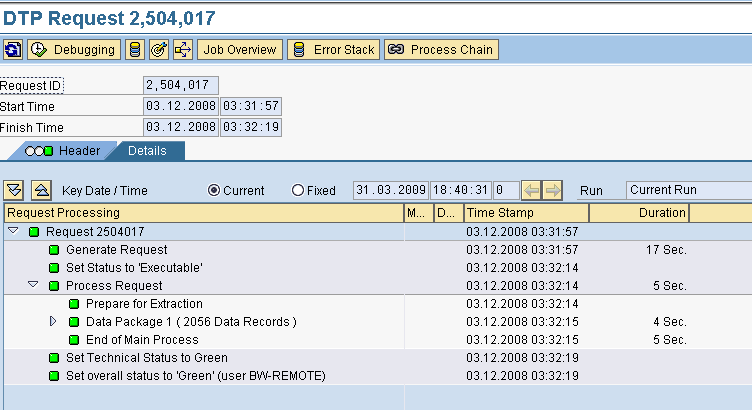
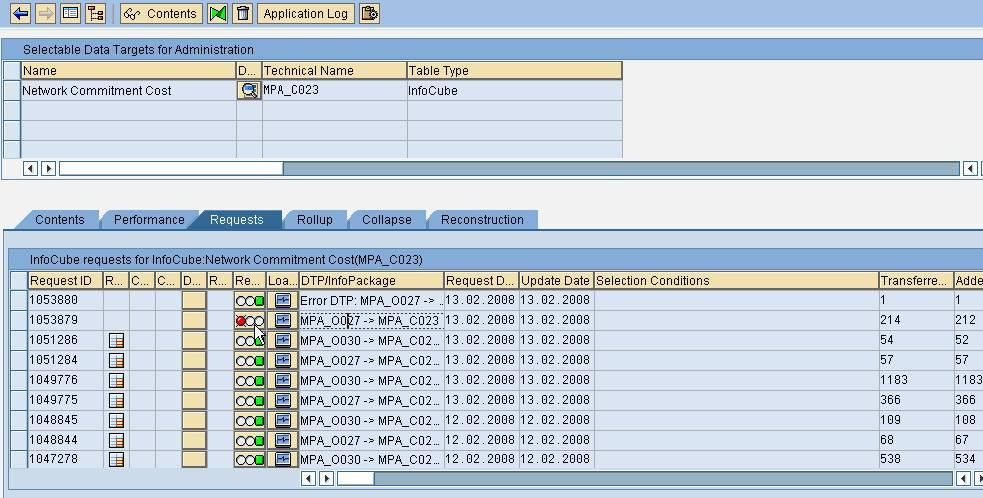
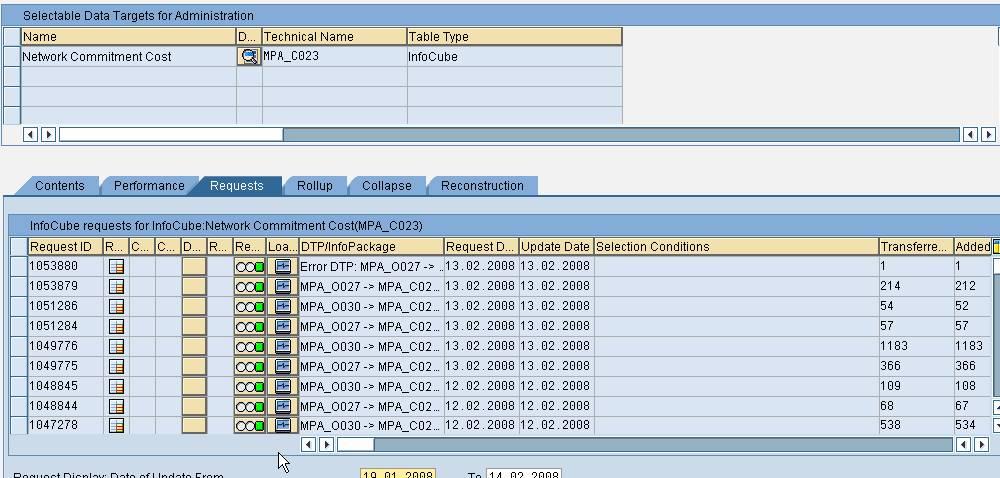
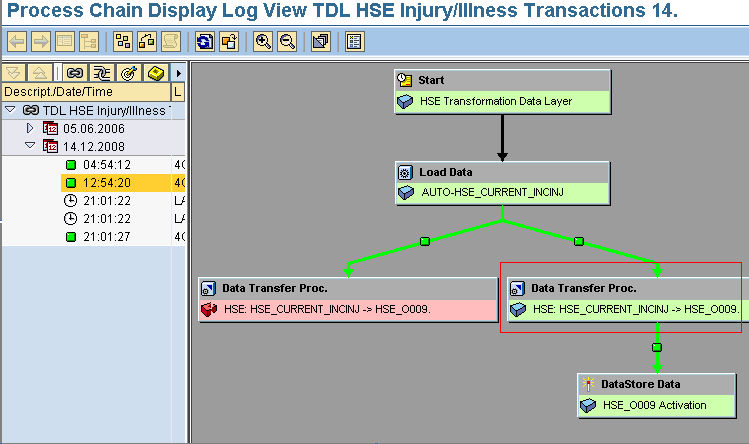
3.4. DTP Ends with Error
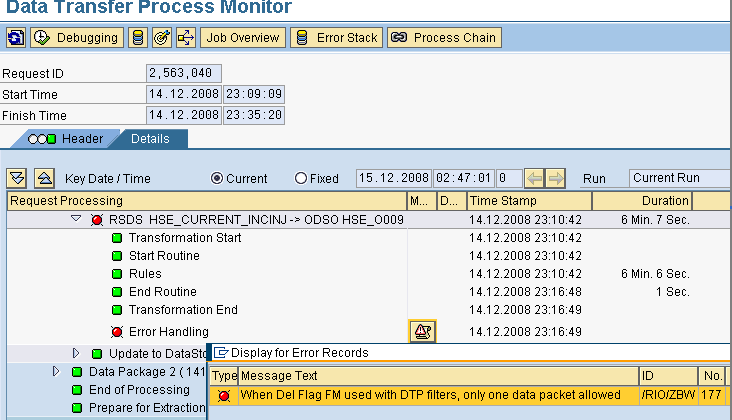
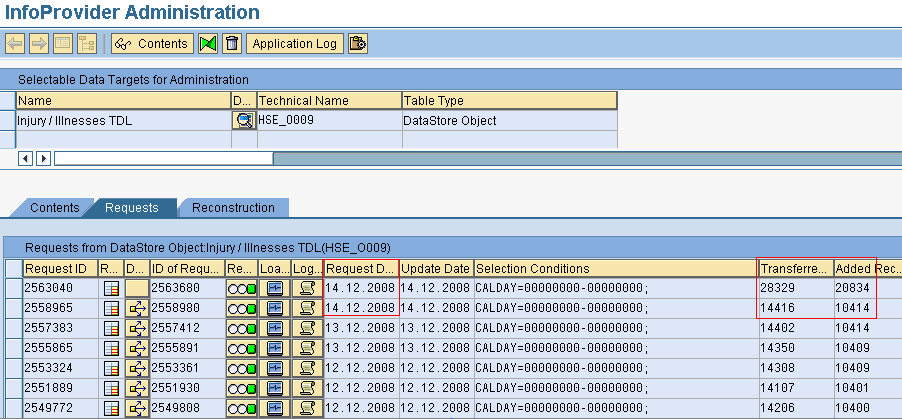
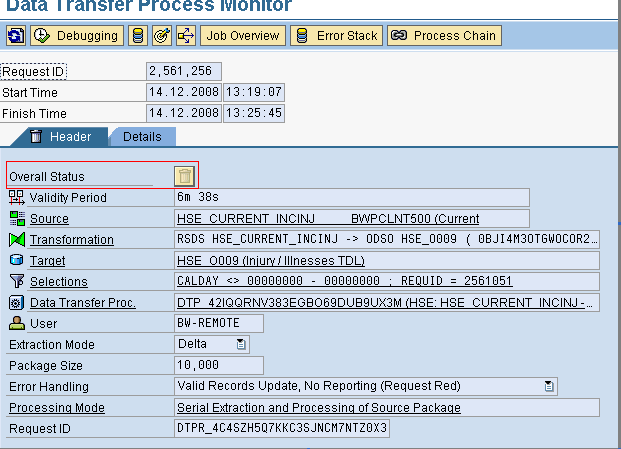
The root cause of the problem was due to the data packet which was received in the last cycle was not processed. Hence 2 data packets were processed during current cycle which resulted in this error.
Even though the process request was GREEN, the data was not updated in target.
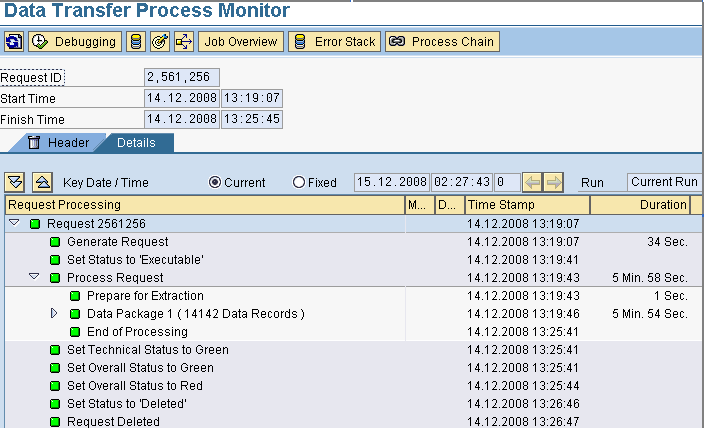
Overall status in Header tab shows deleted.
Target has no signs of these 14142 data records that were extracted on 14/12 during last cycle. But these last cycle extracted records were updated in target during current cycle. Total records transferred during current cycle 28329.